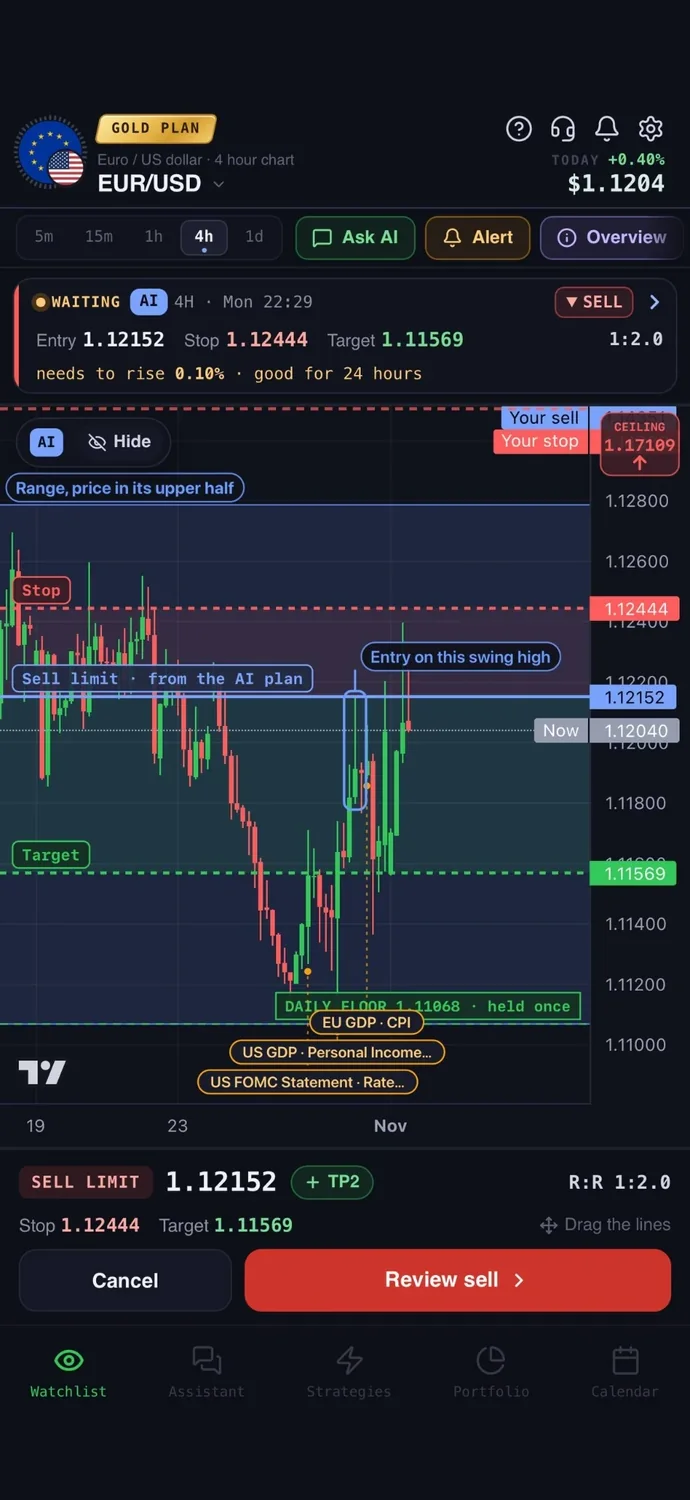
Candlestick reversal patterns are candle shapes that traders read as a possible change of direction after a move. They are clues, not promises. The real skill is telling lookalikes apart: the same shape carries a different name depending on the trend before it, and a pattern only means something once the candle has closed and price has shown a next step.
What Candlestick Reversal Patterns Can Tell You
A candlestick reversal pattern is one candle or a short group of candles that appears after a trend and suggests the move may be losing strength. Notice the word "suggests". Price can pause, move sideways or carry on in the old direction right after a textbook pattern. Treat every pattern as a question to check, not an answer.
This guide is not a second general overview. If you need the basics of open, high, low, close, bodies and wicks (the thin lines above and below the body), start with our guide to candlestick patterns. Here the job is narrower: how to choose between shapes that look almost the same.
The patterns are often split into two groups. Bullish reversal candlestick patterns appear after a decline and hint that buyers may be taking over. Bearish reversal candlestick patterns appear after a rise and hint that sellers may be taking over. The table below puts the common ones side by side. It shows no strength ranking or success rate, because a shape alone does not earn one.
| Pattern | Candles | Trend before | Distinguishing feature | Also check |
|---|---|---|---|---|
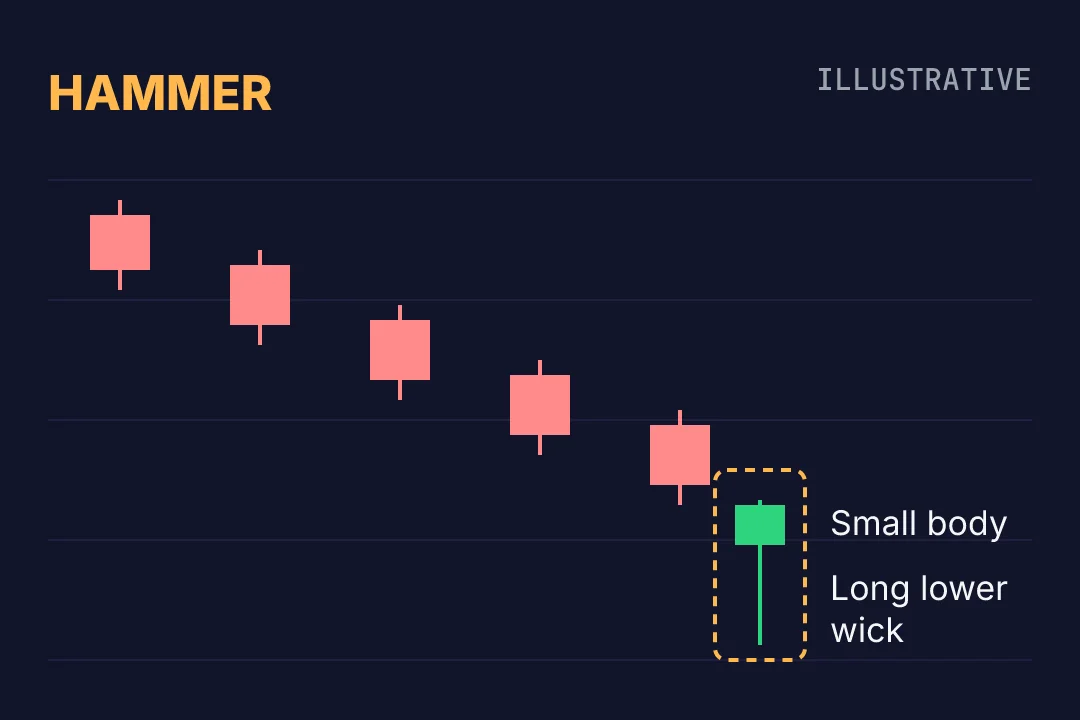
| Hammer | 1 | Decline | Small body near the top, long lower wick | Close of the candle, next candle |
| Hanging man | 1 | Rise | Same shape as the hammer | Whether the next candle closes lower |
| Inverted hammer | 1 | Decline | Small body near the bottom, long upper wick | Whether buyers follow through |
| Shooting star | 1 | Rise | Same shape as the inverted hammer | Whether the next candle closes lower |
| Bullish engulfing | 2 | Decline | Bullish body covers the prior bearish body | Second candle is complete |
| Bearish engulfing | 2 | Rise | Bearish body covers the prior bullish body | Second candle is complete |
| Morning star | 3 | Decline | Small middle candle between a bearish and a bullish one | Third candle closes well into the first body |
| Evening star | 3 | Rise | Small middle candle between a bullish and a bearish one | Third candle closes well into the first body |
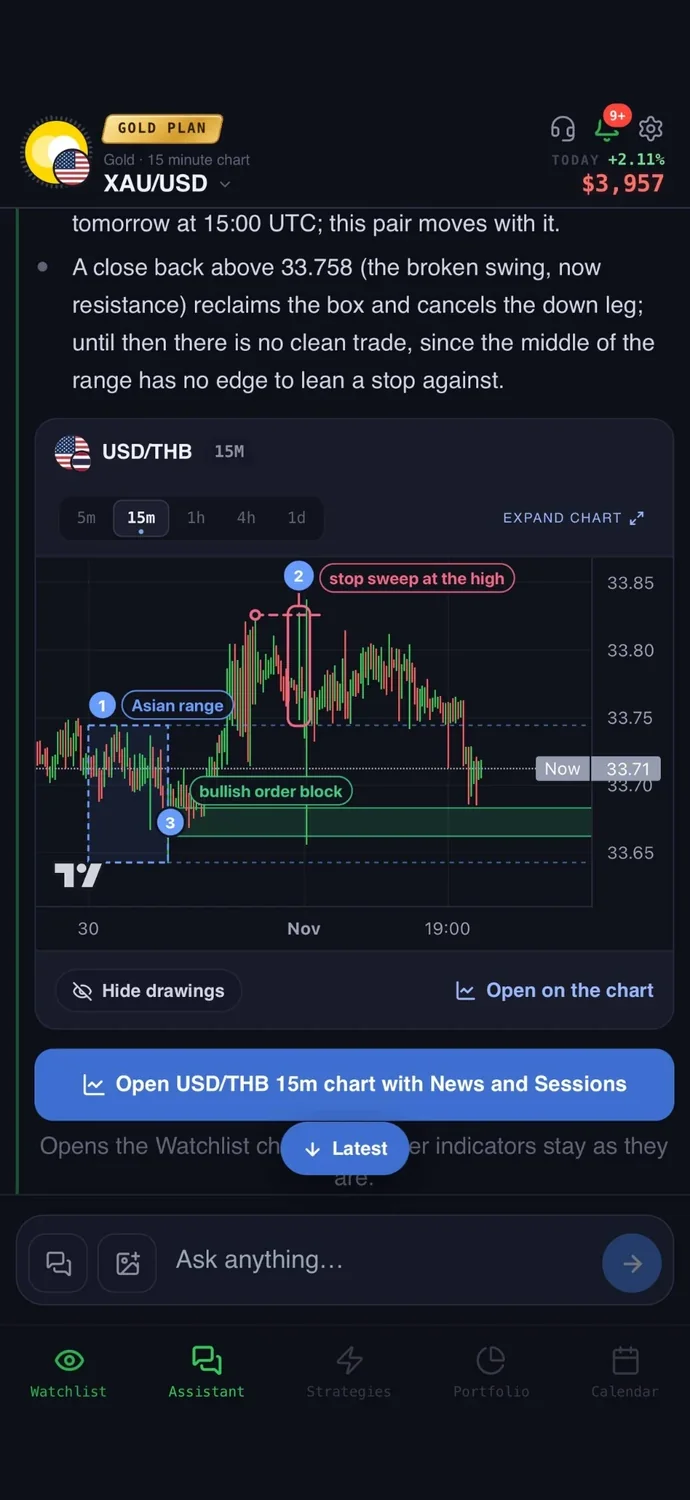
Similar Shapes, Different Trend Context
Four of the single-candle names in the table describe only two shapes. One shape has a long lower wick and a small body. The other has a long upper wick and a small body. What changes the name is the trend that came before. Descriptions of candlestick pattern definitions make the same point: the hammer and the hanging man share a shape, and so do the inverted hammer and the shooting star.
Colour needs a careful reading too. A small body can be green or red, and the colour alone does not decide the direction of a reversal. Some sources note that a bullish colour on a hammer tends to look more convincing, but it is a mild hint, not a rule. Look at where the candle sits in the trend and where it closed.
Hammer vs Hanging Man
Both candles have a small body in the upper part of the range and a long lower wick. The wick shows that price fell sharply during the candle, then recovered to close near where it opened.
The difference is context:
- After a decline, the shape is called a hammer. The idea is that sellers pushed price down, but buyers answered strongly.
- After a rise, the same shape is called a hanging man. The idea is that a sharp drop appeared inside an uptrend, which may warn that buyers are less comfortable.
A common teaching guide is a lower wick about twice as long as the body, with little or no upper wick. Treat that as a rough guide for learning, not an exact test. A wick 1.8 times the body is not meaningless, and a wick 2.2 times the body is not a guarantee. For a further explanation of the pair, see this lesson on the hammer and inverted hammer.
Completion matters more than the name. Say a market has fallen for several candles and a hammer is forming on the 1h chart. Until the hour ends, the close can still change, and the candle can finish as something quite different. Even a finished hammer is one candle, not a changed trend. A cautious reader waits to see what the next candle does. If it closes above the hammer's high, the idea gains some support. If it closes below the hammer's low, the idea has weakened. The hanging man works the other way round: the next candle closing below its low gives the idea some support, and a close above its high weakens it.
Inverted Hammer vs Shooting Star
Here the small body sits in the lower part of the range and the upper wick is long. During the candle, buyers pushed price up, but price came back down and closed near the open.
The naming works the same way:
- After a decline, the shape is an inverted hammer.
- After a rise, the shape is a shooting star.
The inverted hammer is the one beginners misread most. A long upper wick after a decline shows that buyers tried and failed to hold the higher prices. That is not yet a buy signal. It only shows that buyers made an attempt. What happens on the next candle tells you much more. If it opens and closes higher, the attempt may have found support. If it falls through the low of the inverted hammer, the attempt failed.
The shooting star is its mirror after a rise. The long upper wick says buyers pushed higher and could not hold it. Again, one candle is a warning, not proof.
To compare the two pairs, picture a chart where price drops from 100 to 90 over several candles. A candle with a long lower wick at 90 is a hammer, and one with a long upper wick at 90 is an inverted hammer. Now picture price rising from 90 to 100. The same two shapes at 100 become a hanging man and a shooting star. The shapes did not change. The position in the trend did.
Bullish and Bearish Engulfing
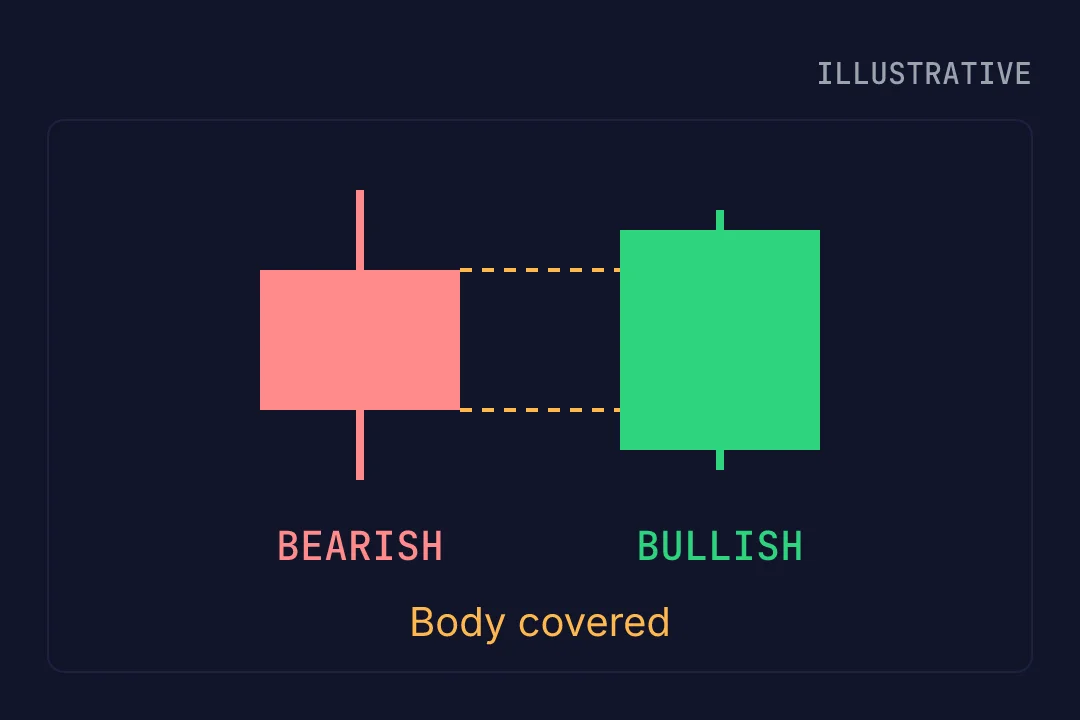
An engulfing pattern uses two candles. In a bullish engulfing pattern, a bearish candle is followed by a bullish candle whose body covers the whole body of the first one. In a bearish engulfing pattern, a bullish candle is followed by a bearish candle whose body covers the first body.
Say a candle opens at 100 and closes at 98, a bearish body. The next candle opens at 97.5 and closes at 100.5. Its body runs from 97.5 to 100.5 and covers the earlier body from 98 to 100. That is a bullish engulfing candle.
Illustrative candle pair: engulfing refers to the bodies, not necessarily the full wick ranges.
A few points keep the name honest:
- Context. A bullish engulfing candle is read after a decline, a bearish one after a rise. The same two candles in the middle of a sideways range say much less.
- Completion. The second candle must be closed. A candle that engulfs the first at one moment can finish inside it.
- Bodies, not wicks. The wicks do not have to be covered. Do not demand that the whole high to low range is swallowed.
- Not an outside bar. An outside bar is a candle whose full range, high and low, exceeds the previous candle's range. An engulfing pattern is about bodies, so the two ideas overlap sometimes but are not the same.
Gaps also deserve a note. In many stock charts, a candle can open away from the previous close because the market was shut overnight. Currency quotes trade almost continuously on weekdays, so a candle often opens very near the previous close. The textbook picture of a gap before the second candle may therefore look different in forex, and that does not make the pattern invalid.
Morning Star and Evening Star in Brief
A morning star is a three-candle bullish reversal pattern after a decline. The first candle is a large bearish one. The second is a small candle, often a spinning top or a doji, showing hesitation. The third is a bullish candle that closes well into the first candle's body. An evening star is the mirror image after a rise: a large bullish candle, a small candle, then a large bearish candle.
The full method, with a worked example and an entry walkthrough, is in our guide to the morning star candlestick pattern, so it is not repeated here. For comparison purposes, one point is enough: the three-candle version asks for more evidence than a single hammer, because it needs the third candle to finish the job.
A doji, which is a candle with almost no body because the open and close are nearly equal, is a sign of indecision. On its own it is not a confirmed reversal. A doji in the middle of a trend can simply be a pause before price continues.
Check Context and Confirmation Before Naming a Reversal
Before you name a pattern, run through a short list:
- Previous trend. Was there a clear move to reverse? Two or three candles drifting sideways are not a trend.
- Location. Is the candle at a zone where price has reacted before, such as an earlier low or high? Our guide to market structure explains how to read those highs, lows and breaks.
- Close. Has the candle, or the final candle of the group, actually closed?
- Next observable step. What would you expect to see if the idea is right?
- Cancellation. At what price is the idea wrong?
One way to handle step 4 is to wait for the next candle to close beyond the pattern's range. For a hammer, that means a close above its high. For a shooting star, a close below its low. This is one analysis choice, not a standard that every strategy must follow. Some traders act on the pattern candle itself, and others wait for more. Waiting usually means a worse entry price but fewer early mistakes, and both sides of that trade-off are real.
The cancellation level is often the other end of the pattern. If you read a hammer as a bullish clue, a close below its low cancels the idea.
Now compare two similar situations. In the first, price falls to an area where it turned up twice before, and a hammer forms there. The shape has a reason to matter: it appears at a place where buyers have shown interest. In the second, the same hammer appears in the middle of a sideways range, with no clear decline before it and no nearby zone. Nothing was being reversed, and the candle is more likely to be noise.
Timeframes can disagree as well. A bullish pattern on the 15m chart may sit inside a strong downtrend on the 4h chart. The smaller signal is then a pause inside a bigger move, and you should weigh it that way. No timeframe is best for everyone. Choose the one that matches how long you intend to hold, and check the next one up.
Why a Completed Pattern Can Still Fail
A pattern can finish exactly as described and price can still move against it. That is normal, not a sign you misread the chart. A reversal pattern describes one moment in a market that is affected by many things at once.
Common reasons for failure:
- News. A scheduled release or an unexpected headline can push price through a pattern within minutes. Check the economic calendar before relying on a small candle on a short timeframe.
- Range conditions. In a sideways range, reversal shapes appear often and mean little, because price is already moving back and forth.
- Costs. Spreads and fees take a share of every small move. A pattern that suggests a small bounce may leave little after costs.
- Weak context. A shape with no clear trend before it, no zone and no confirmation is only a shape.
- Price passes the cancellation level. If price closes beyond the point where the idea was wrong, the scenario is over. Holding on and hoping is a different decision from the one you planned.
A word on volume. On exchange-traded stocks and crypto exchanges, volume is a count of what traded and can add a clue. Spot forex has no single central exchange, so volume figures from a chart feed reflect only part of the market and should not be treated the same way.
Finally, planned risk is not guaranteed maximum loss. If you plan to risk a certain amount with a stop (an order to exit at a set price), a fast market can fill it at a worse price. This is called slippage. It is one more reason to size positions with room to spare and to avoid assuming that any percentage of risk, leverage or timeframe suits everyone.
A Reversal-Pattern Comparison Checklist
Use this list to choose a name and judge how much weight the pattern deserves:
- Shape first. Long lower wick and small body: hammer or hanging man. Long upper wick and small body: inverted hammer or shooting star. Body covering the prior body: engulfing. Small candle between two large opposite ones: a star.
- Context decides the name. After a decline, use the bullish name. After a rise, use the bearish name. With no clear trend, be sceptical of any name.
- Body and wick. Compare wick length with body size as a rough guide, not an exact rule. Do not let colour alone decide direction.
- Completion. Has the candle closed? Has the last candle of a group closed?
- Confirmation status. Write down whether the idea is only forming, closed but unconfirmed, or confirmed by your chosen next step.
- Zone and bigger timeframe. Does the pattern sit at a meaningful area, and does the next timeframe up agree or disagree?
- Risk. Where is the idea cancelled, how much would you lose there, and could news or slippage make that worse?
The checklist narrows a pattern down but does not predict what price will do next. The extra evidence you add around it is what makes the difference. In the AiTradely app, you can ask the AI assistant about an asset to see the trend, indicators and news behind a candle, and read the daily analysis for the written reasoning. The strategy builder also has candle pattern conditions, such as engulfing, hammer and shooting star, which you can combine with RSI, volume or a price level, backtest on history and set as an alert. You then decide whether a setup deserves your attention and place any trade yourself.
Nothing here is financial advice. A completed candlestick pattern can still be followed by a move in the opposite direction, so any trade based on one can lose money.
 AiTradelyYour AI trading analyst, in your pocketAI analysis for gold, forex and stocks. Build and backtest strategies, get signals, and trade from your own broker account.
 On your phoneScan for the app