
Volume is the bars along the bottom of your chart that most traders glance at and few actually read. It answers a question price cannot: how many people were involved in this move? A 2% rally on heavy participation and a 2% rally on almost none look identical on the price line and mean very different things.
What volume actually tells you
Volume counts how much was traded during a bar — shares, contracts, or coins. That is all it measures. It says nothing about direction; a huge volume bar can print on a rally or a collapse.
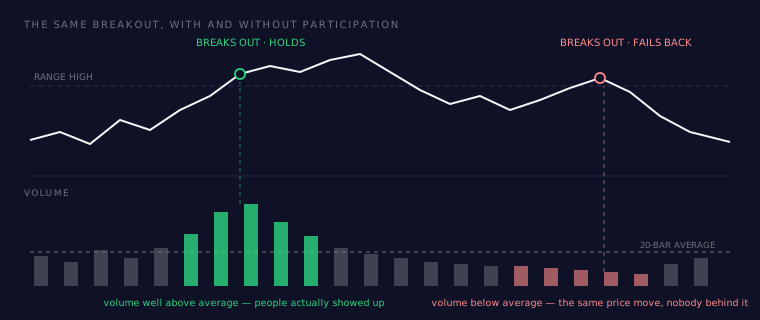
What it does tell you is conviction. Price moves because buyers and sellers disagree about value. Volume tells you how many of them showed up to that disagreement. A breakout that thousands of participants took part in is a different event from one that drifted through on a quiet afternoon, even if the closing prices match.
The useful mental model: price is the claim, volume is the evidence.
Read it relative, never absolute
A single volume number is meaningless on its own. Two million shares is enormous for one stock and a slow morning for another. Volume is also seasonal — thinner in August, thinner on holidays, thinner in the hours between sessions.
So the only useful reading is relative: how does this bar compare to recent bars? The standard approach is to compare each bar against a moving average of volume — a 20-bar average is a common choice — and think in multiples. A bar at twice its average is notable. A bar at 0.4× its average is a market that has gone to sleep, whatever price did.
This is why "high volume" is never a fixed number. It is always high compared to what this asset normally does.
Confirmation and divergence
Once you are reading relative volume, two patterns do most of the work.
| What price does | What volume does | Usual read |
|---|---|---|
| Breaks to a new high | Rises well above average | Confirmation — participation backs the move |
| Breaks to a new high | Falls below average | Suspect — the level broke but nobody came |
| Trends higher | Declines steadily | Trend is losing participation, not necessarily reversing |
| Sells off hard | Spikes far above average | Possible capitulation — worth watching for exhaustion |
| Goes nowhere | Dries up completely | Range is maturing; a volatility expansion often follows |
The most practical of these is the first pair. A level that breaks on heavy volume tends to hold better than one that breaks on light volume, because the light-volume break often means the move was a few participants pushing into an empty book — and empty books retrace easily.
Volume divergence is the third row: price grinding to new highs while volume shrinks on each push. That is a trend running on fewer and fewer participants. It is a warning to tighten risk, not a signal to reverse — trends can thin out for a long time before they end.
The problem nobody mentions: not all volume is real
This one matters more than any pattern above, and most guides skip it.
Spot forex has no central exchange. There is no single venue counting every EUR/USD trade, so the "volume" your platform shows for a currency pair is usually tick volume — the number of price updates in that bar, not the amount traded. It correlates with real activity well enough to be somewhat useful, but it is a proxy, and it is not what the word volume means everywhere else on your screen. The same applies to spot gold and silver.
Crypto volume varies in quality by venue. Exchange-reported figures have historically included wash trading, so the same coin can show very different volume depending on which venues are aggregated.
Stocks, futures and ETFs have real volume, reported from actual exchanges. If you want to learn to read volume properly, learn it on those first, where the number means what it says.
Practical consequence: a volume-based rule that works beautifully on equities may be reading noise on spot FX. That is not a flaw in your method — it is a flaw in the data underneath it.
How to read volume, step by step
- Add a volume moving average, 20 periods is standard, so every bar has something to be compared against.
- Ask what multiple this bar is. Roughly twice average or more is significant; well below average is a market that has checked out.
- Check volume at the moment that matters — the breakout bar, the reversal bar, the gap — not the average across the whole chart.
- Compare the move to the participation. Big price move on big volume is coherent. Big price move on small volume is a claim without evidence.
- Watch the trend of volume across a run of bars, not just one. Fading volume through a rally is the divergence worth noticing.
- Know what your volume actually is. On spot FX and spot metals, remember you are reading tick counts, not traded size.
Common mistakes
- Reading volume as directional. A volume spike says a lot happened, not that price is going up.
- Comparing across assets. Volume is only comparable to the same asset's own history.
- Treating every spike as capitulation. Spikes also happen on news, on index rebalances, and at expiry, where they mean something entirely different.
- Trusting spot FX volume as real volume. It is a tick count.
- Ignoring it entirely. Volume is the only common indicator that is not calculated from price, which is exactly what makes it a genuine second opinion.
How AiTradely uses this
Because volume is not derived from price, it makes an unusually good confirmation filter — most indicators are just price rearranged, so stacking three of them tells you the same thing three times.
In the strategy builder, volume is available as a condition expressed the way this article recommends: relative to its own 20-bar average, as a multiple. A rule can require that a bar's volume is above 1.5× its average before an entry counts, so a setup that fires on a dead bar is filtered out automatically.
One deliberate behaviour worth knowing: on assets that carry no real volume data — spot FX and spot metals, for the reasons above — a volume condition is skipped rather than failed. Otherwise every volume-filtered strategy on those assets would silently never fire, which looks identical to "no setups found" and would quietly waste your time. The strategy still evaluates its remaining conditions, and the filter simply does not apply where the data cannot support it.
Nothing here is financial advice. Volume describes what has already traded — it does not predict future prices, and no filter removes the risk of loss.