
Finding a good setup with an indicator is only half the job. The other half is deciding how much you are willing to lose if you are wrong, and how much you aim to make if you are right. That is what the risk/reward ratio captures — and it is the piece that ties any strategy together.
What is the risk/reward ratio?
The risk/reward ratio (often written R:R) compares the amount you stand to lose on a trade against the amount you aim to gain. It is measured from your entry price to two points: your stop-loss (the risk) and your target (the reward).
A 1:2 ratio means you are risking one unit to potentially make two. A 1:3 means risking one to make three. The smaller the first number relative to the second, the more favorable the trade's geometry — if the trade works out.
A worked example
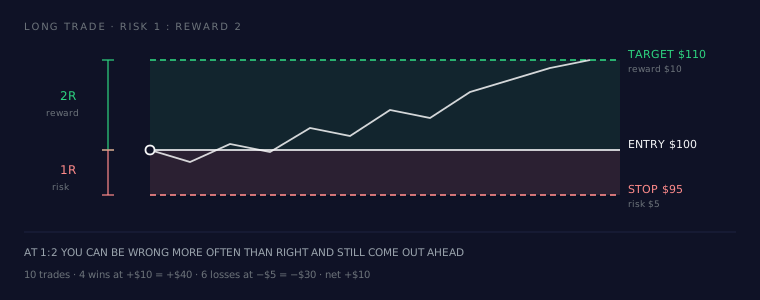
Say you buy an asset at $100:
- You place a stop-loss at $95 — so your risk is $5 per unit.
- You set a target at $110 — so your reward is $10 per unit.
Your risk/reward ratio is $5 : $10, or 1:2. You are risking 5 to make 10.
Why does this matter beyond the trade itself? Because R:R and win rate work together. With a 1:2 ratio, you can be wrong more often than you are right and still come out flat over many trades. That is the core reason traders care about it — it shifts the math in your favor over a series of trades, though no ratio guarantees the outcome of any single one.
How to calculate R:R
The formula is straightforward:
Risk = entry price − stop price (for a long) Reward = target price − entry price (for a long) R:R = risk : reward
For a short trade, flip the subtraction. Many traders set a minimum R:R — often 1:1.5 or 1:2 — and simply skip setups that do not clear that bar before entering.
Why it matters
Without an R:R rule, it is easy to take trades where a small win is chased with a large potential loss — the exact opposite of what you want. A consistent minimum ratio forces you to only take setups where the potential payoff justifies the risk. It also removes emotion from the decision: the numbers either clear your threshold or they do not.
Position sizing basics
R:R decides the shape of a trade; position size decides how much the trade can actually cost you. A common approach is to risk only a small, fixed percentage of your account on any single trade — many traders use around 1–2%.
The link is your stop distance. Once you know:
- How much of your account you will risk (say, 1%), and
- How far away your stop is (in price terms),
you can work backward to a position size so that if the stop is hit, the loss equals that fixed percentage — no more. Tighter stops allow a larger size for the same dollar risk; wider stops require a smaller size. This keeps a single bad trade from doing outsized damage.
Stop-loss placement: structure vs ATR
Where you put the stop drives everything above, so it deserves care. Two common methods:
- Structure-based: place the stop just beyond a meaningful level — below a recent swing low (for a long) or above a swing high (for a short). The logic: if price breaks that level, your trade idea is probably wrong.
- ATR-based: use the Average True Range, a volatility measure, to set the stop a set multiple of ATR away from entry. This adapts the stop to how much the asset naturally moves, so you are less likely to be shaken out by normal noise.
Neither is "correct" — structure stops respect the chart, ATR stops respect volatility, and many traders blend both. The key is that the stop is chosen deliberately before you enter, not moved in a panic afterward.
How AiTradely uses this
When you plan a trade in AiTradely's Portfolio and position-sizing tools, you can enter your account risk and stop distance to see a suggested position size, and the trade view surfaces the risk and reward levels for a setup so the R:R is visible before you commit. It is designed to help you size and structure trades on your own terms — it is analytical support, not financial advice or a promise of any result.
Ready to go find setups to manage? Start with the MACD indicator or learn to read RSI divergence.