
The MACD indicator is one of the most widely used tools in technical analysis because it packs both trend direction and momentum into a single, readable display. This guide explains what MACD is, how to read each of its three parts, what crossovers and divergence mean, and how it compares to RSI.
What is MACD?
MACD stands for Moving Average Convergence Divergence. It measures the relationship between two moving averages of price to show whether momentum is building or fading. When the two averages pull apart, momentum is strengthening; when they converge, it is weakening. Because it is built from moving averages, MACD is both a trend and a momentum tool at once.
The three parts of MACD
MACD has three components, and reading it well means knowing what each one does.
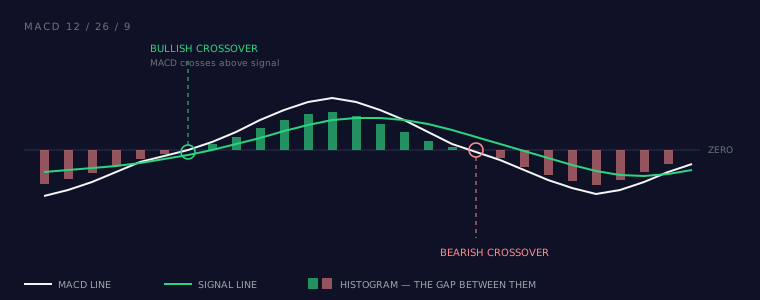
- MACD line: the difference between a fast and a slow exponential moving average (EMA) of price. It moves quickly and reflects short-term momentum relative to the longer trend.
- Signal line: an EMA of the MACD line itself. It moves more slowly and acts as a trigger for the MACD line to cross.
- Histogram: the gap between the MACD line and the signal line, drawn as bars. Bars grow as the two lines separate and shrink as they close in — a quick visual read on whether momentum is accelerating or decelerating.
Common settings: 12/26/9
The default MACD settings are 12, 26, 9:
- 12 — the fast EMA period.
- 26 — the slow EMA period.
- 9 — the signal line period.
These defaults work across most markets and timeframes, which is why they are so common. Shorter numbers make MACD more sensitive (more signals, more noise); longer numbers make it smoother (fewer signals, more lag). Most traders start with 12/26/9 before adjusting anything.
Crossovers
Crossovers are the most common way MACD is read:
- Bullish crossover: the MACD line crosses above the signal line. Momentum is turning up. On the histogram, the bars flip from below zero toward above.
- Bearish crossover: the MACD line crosses below the signal line. Momentum is turning down.
- Zero-line crosses: when the MACD line itself crosses above or below zero, it means the fast EMA has crossed the slow EMA — a broader shift in trend direction.
Crossovers near the zero line tend to be less reliable (the market is often indecisive there), while crossovers that happen after a stretched move can carry more weight. As with any single signal, a crossover is a prompt to look closer, not an instruction to trade.
MACD divergence
Just like with RSI, divergence appears when price and MACD disagree — for instance, price makes a higher high while the MACD line or histogram makes a lower high. This hints that the move is losing momentum. If you want the full method for reading this pattern, see our guide on RSI divergence and how to spot it; the same logic applies directly to MACD, and traders often look for both to agree.
RSI vs MACD
RSI and MACD are both momentum tools, but they answer slightly different questions.
| RSI | MACD | |
|---|---|---|
| Measures | Speed of recent gains vs losses | Relationship between two moving averages |
| Scale | Bounded 0–100 | Unbounded, centered on zero |
| Best at | Spotting overbought/oversold extremes | Reading trend + momentum shifts together |
| Main signal | Threshold levels (70/30) and divergence | Crossovers, zero-line, histogram, divergence |
RSI is quicker to flag when a move is stretched; MACD is better at showing whether a trend is gaining or losing steam. Many traders use them together — RSI for timing, MACD for direction. If you are new to RSI, start with what RSI is and how to use it.
Once MACD helps you find a setup, the harder part is managing it. Decide your stop and target first — our guide on how to use the risk/reward ratio walks through keeping each trade's downside controlled.
How AiTradely uses this
AiTradely's Strategy Builder lets you write MACD conditions — crossovers, zero-line crosses, or divergence — into a rule set, then combine them with other indicators so a setup only flags when your full logic lines up. The AI assistant can also explain what MACD is currently showing on an asset you follow in plain English. These are tools to support your own analysis, not trade signals or advice.