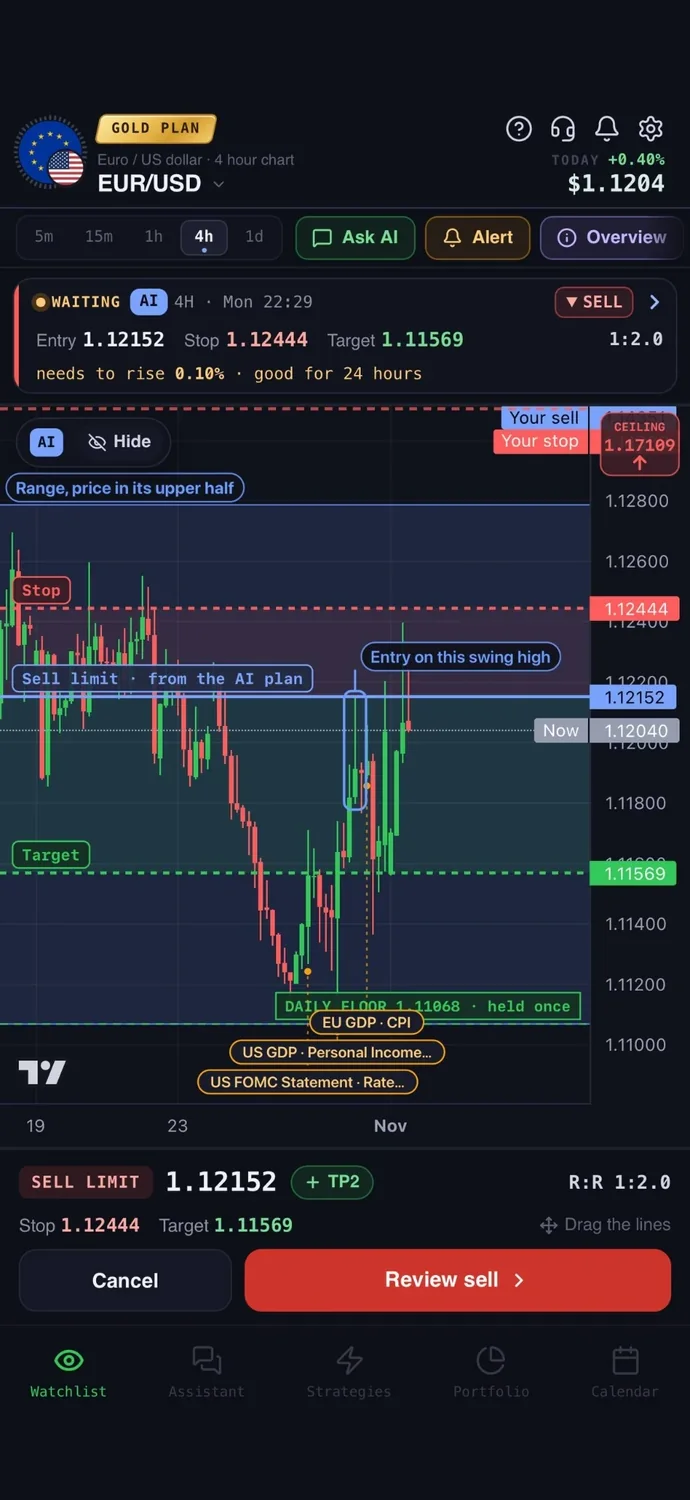
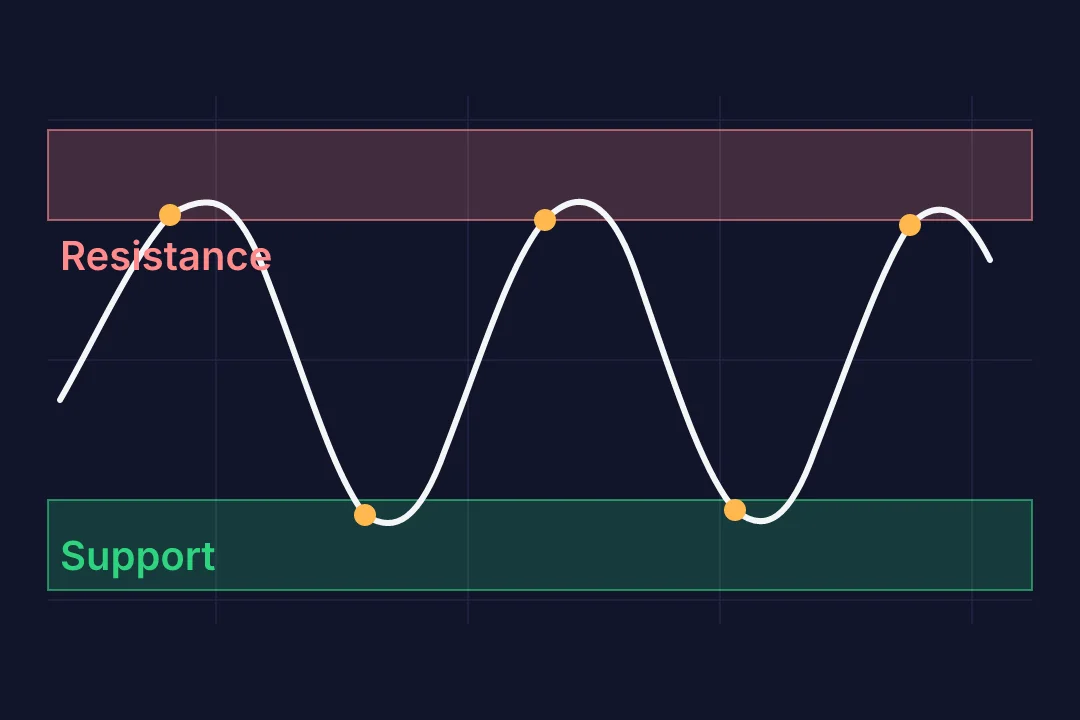
Support and resistance are price areas where a market has reacted before: support sits below the current price, where falling prices have stopped and turned up, and resistance sits above it, where rising prices have stopped and turned down. They are best drawn as zones, not single lines, and they are observations of past behaviour, not guarantees of what price will do next.
What Are Support and Resistance?
Support is an area below the price you are looking at where a decline has paused or reversed before. Resistance is an area above it where a rise has paused or reversed before. The words only make sense relative to the current price: a zone under price is support, a zone over price is resistance.
The usual explanation is a balance between buyers and sellers. When buyers outnumber sellers, price tends to rise. When sellers outnumber buyers, it tends to fall. A turning point is where that balance appeared to shift.
These zones are not walls. Price can pass through them, stop short of them or slice through and come back. They also do not prove that orders are waiting there. They only show where the market reacted in the past. Major levels are rarely exact prices, which is why support and resistance zones are a more useful idea than single lines.
The swings that create these zones are part of market structure, the pattern of highs and lows. Here we only use those swings to place zones. The same approach applies to support and resistance in forex, stocks, gold and crypto.
How to Draw Support and Resistance Zones
Start with horizontal zones. Follow these steps in order:
- Fix the instrument, the period and the timeframe. Say you look at one pair on the 1h chart over the last few weeks. Changing any of the three changes the zones.
- Look at a higher timeframe first, such as the 4h or daily. Zones that stand out there matter more than small ones on the 1h chart.
- Mark the clear turning points and the places price reacted more than once.
- Merge marks that sit close together into one band, from the lowest to the highest of them.
- Keep only the zones near the current price, one or two above and one or two below. Zones far away are not useful for the next decision.
There is no universal zone width in pips. A zone should be as wide as the reactions you can actually see. On a quiet chart it may be narrow. On a volatile one it may be much wider.
This is the core of support and resistance trading: a short list of areas you can name, not a chart full of lines.
The same habit of reading price movement first, then adding tools, is what price action analysis describes.
Two details decide how good your zones are.
Choose Swing Points Without Hindsight
A swing high is a peak with lower prices around it. A swing low is a trough with higher prices around it. Use only swings that were visible at the moment you are analysing.
There is a delay. A candle is only confirmed as a swing high after later candles fail to exceed it. Say you require two lower candles after the peak. Then the swing is known two candles after it formed, not on the peak itself. The newest extreme on the chart is not yet a confirmed swing, so do not draw it as a known level.
Hindsight is the usual trap. On a finished chart every turning point looks obvious. If you go back and mark only the turns that later mattered, the zones will look much better than they would have in real time.
More touches mean more observations, so a zone with four reactions tells you more than one with two. It does not mean the zone will hold next time.
Use Wicks and Bodies Consistently
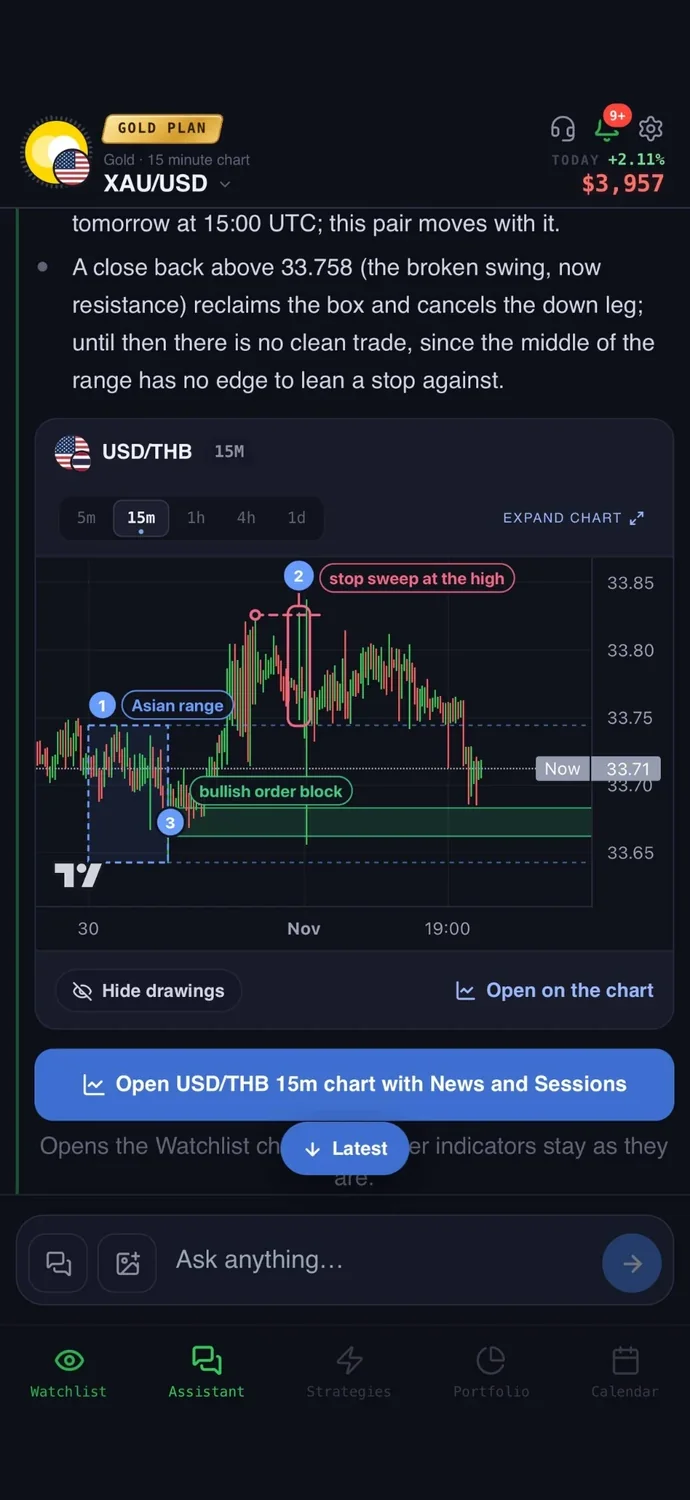
Price often pokes slightly past a zone and comes back. The wick (the thin line showing the high or low of a candle) captures that poke. The body (the thick part between open and close) shows where the period ended. Because they differ, the reactions at one area rarely line up on a single price.
That is why zones exist. A practical approach is to pick one rule and apply it everywhere. For example, draw the zone from the highest wick to the highest body close in the cluster. Or use only closes. Neither is the one correct method. What matters is that you use the same rule on every zone, so your zones are comparable.
Quotes also differ a little between data sources, so a zone that looks perfect on one chart may be a few points off on another. Another reason not to treat a zone as an exact price.
A Test, a Breakout or a False Break?
Price reaching a zone can end three ways. The table uses a close beyond the zone as the working test. That is a criterion you choose, not proof that the move will continue.
| Situation | What you see | What it may mean |
|---|---|---|
| Test and bounce | Price touches or enters the zone, then turns away | The zone still held this time |
| Breakout | A candle closes beyond the far edge of the zone | Price has moved out of the area |
| False break | Price closes beyond the zone, then quickly closes back inside | The break did not hold |
A close is more informative than a wick because it shows where price settled. Still, no signal removes the need for confirmation and a defined risk. Some charting tools use a different close for the same candle, so check your own setup.
Not every false break is a hunt for stops or the work of large institutions. Often it is just price failing to continue. Treat it as information, not as a story.
When Resistance Becomes Support
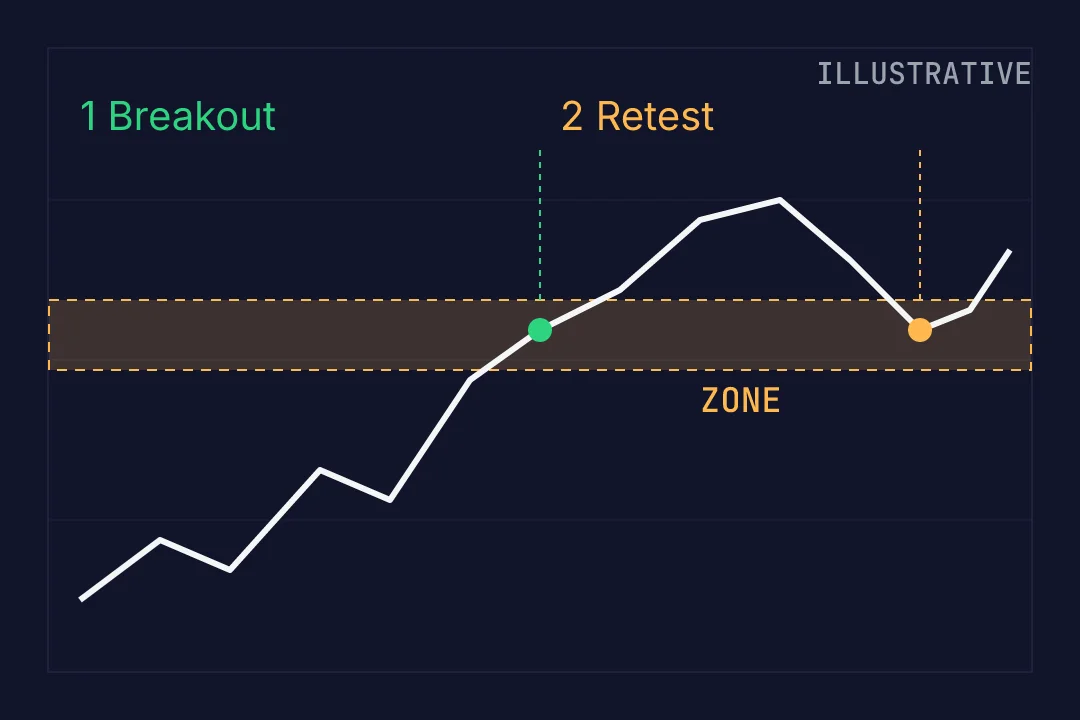
A zone can change its role. Suppose price repeatedly stalls under a resistance zone, then closes above it. If price later falls back to that same zone from above and bounces, the old resistance is acting as support. The mirror case also exists: broken support can turn into resistance when price returns to it from below.
The idea is that the area still matters to traders, so price may react there again. It is a possibility, not a rule.
A retest may never happen: price can leave and not come back. And when it does return, the old level may not hold. Price can close back inside or fall through. Plan for both outcomes before it happens.
The diagram shows one illustrative path: approach from below, a break up, a return to the same zone from above and a small bounce.
A Hypothetical EUR/USD Zone Example
This is a made-up teaching example on a 1h chart, not real market data and not a trade that happened.
Say a zone spans 1.1000 to 1.1010. On the left of the chart, price turned down from it three times, so it was resistance. Later a candle closes at 1.1020, above the top edge. Then price drops back into the zone.
Two cases follow:
- Hold: price enters the zone, finds buyers and closes back above 1.1010. The old resistance is behaving like support.
- Fail: a candle closes below 1.1000. The idea is cancelled, because price has gone back under the whole zone.
Now compare distances. Say you considered a buy near 1.1012 with the invalidation point just under 1.1000, about 12 pips away. The nearest obstacle above is a resistance zone around 1.1060, about 48 pips away. The reward to that obstacle is roughly four times the distance to cancellation. That comparison is the risk/reward ratio. If the obstacle were only 10 pips away, the same setup would look weak.
Real execution adds costs. You buy at the ask and sell at the bid, and the spread (the gap between them) eats into the distance. A stop can also fill at a worse price than planned, so planned risk is not a guaranteed maximum loss.
A Clean-Chart Checklist
Before you trust a zone, check:
- Significance: has price reacted here more than once, and is it visible on a higher timeframe?
- Scale: is it close enough to current price to matter for your timeframe?
- Available data: was every swing you used visible at the time, with no hindsight?
- Confirmation: what do you need to see, such as a close beyond the zone, before acting?
- Opposite scenario: what happens if the zone fails, and where is that point?
Common mistakes:
- Drawing dozens of lines until something always seems to be near price.
- Moving the edges of a zone to make a result look good.
- Expecting an exact bounce at a precise price.
A clean chart has a few zones, one rule for wicks and bodies, and a plan for both outcomes. There is no best timeframe or perfect zone width for everyone.
Once your zones are drawn, you can ask the AI assistant in the AiTradely app about the same asset to compare your view with the daily analysis and its written reasoning. You could also check the economic calendar for events that may move price into your zones, and then decide for yourself what to do.
Nothing here is financial advice. Support and resistance zones are drawn from past prices, so price can break through any of them, and a stop order can fill worse than planned.
 AiTradelyYour AI trading analyst, in your pocketAI analysis for gold, forex and stocks. Build and backtest strategies, get signals, and trade from your own broker account.
 On your phoneScan for the app