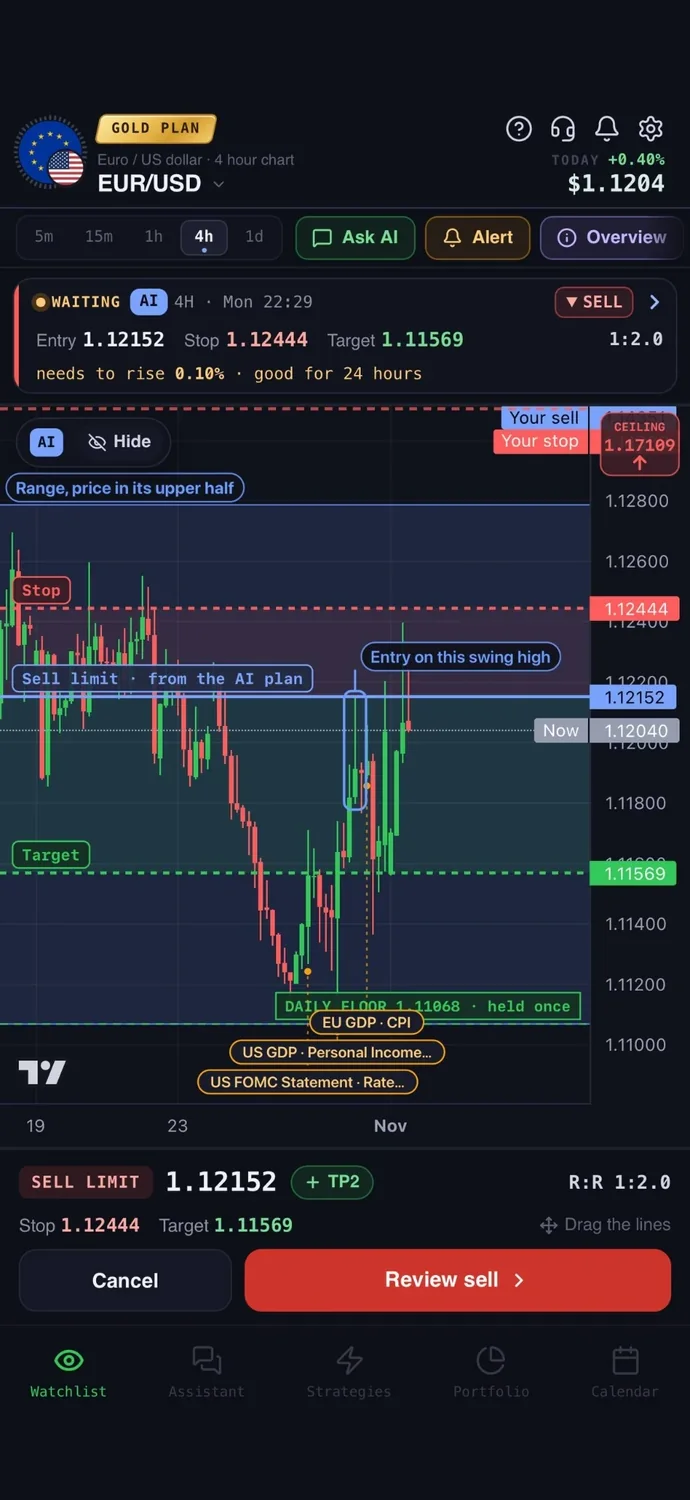
Market structure is the pattern of highs and lows a price chart makes as it moves. Higher highs and higher lows mean an uptrend, lower highs and lower lows mean a downtrend, and a break of the last important high or low tells you the trend may be over. Once you can read that sequence, you know which way the market is leaning, when your idea is wrong, and where a stop loss makes sense.
What market structure means (trading vs economics)
In economics, market structure describes how an industry is organised: how many sellers there are and how much power they have over price. That is not what a trader means.
In trading, market structure is the shape of price itself: the swing highs and swing lows, and whether they step up, step down or move sideways. It works the same way on crypto, forex, gold and stocks, on any timeframe from 5 minutes to a daily chart.
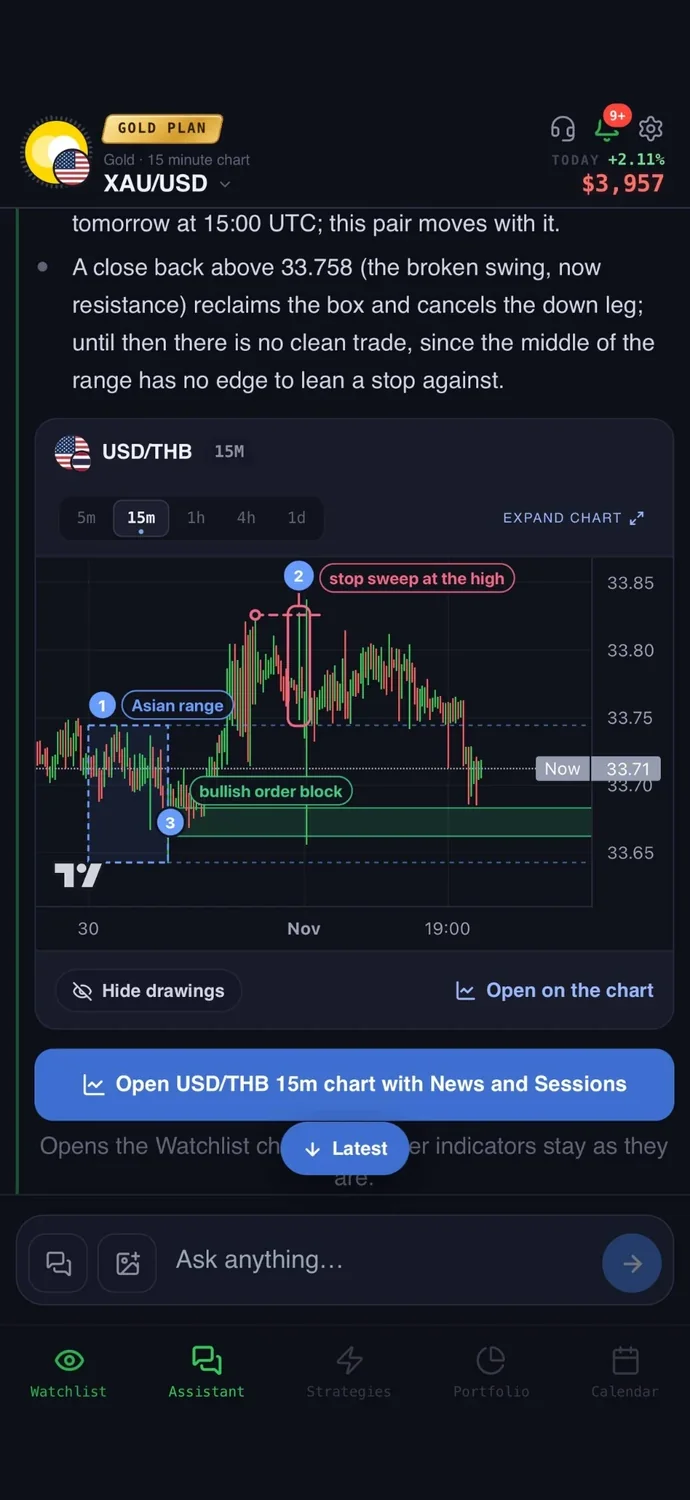
Swing highs and swing lows: the building blocks
A swing high is a peak where price rose, stopped and turned down. A swing low is a trough where price fell, stopped and turned up. Mark the wick tips, because that is where price actually reached.
Not every wiggle counts. A practical filter: a swing point should have at least two candles on each side that do not exceed it, and the move away from it should be clearly visible when you zoom out.
Reading market structure on a chart: uptrend, downtrend, range
Say a stock rises from 100 to 110, pulls back to 105, rises to 118, pulls back to 112, then rises to 125. The highs (110, 118, 125) are higher highs and the lows (105, 112) are higher lows. That is an uptrend: buyers win each dip before it reaches the previous low.
Flip it for a downtrend: lower highs and lower lows.
If a currency pair keeps topping near 1.1000 and bottoming near 1.0900, there is no trend. If you cannot say "higher highs and higher lows" or "lower highs and lower lows" with confidence, call it a range.
Break of structure vs change of character
Break of structure (BOS) is when price breaks a swing point in the direction of the trend. In the uptrend above, the push past 118 to reach 125 was a break of structure up. It confirms the trend is alive.
Change of character (CHoCH) is when price breaks a swing point against the trend. The last higher low was 112, so a fall below 112 is the first sign the trend is weakening.
Decide whether a break counts on the candle close, not a wick. A close at 110 is more convincing than a spike to 110 that closes at 114. Pick one definition and use it every time.
A simple rule for when a trend is over
An uptrend is over when price closes below the most recent higher low that produced a new high. A downtrend is over when price closes above the most recent lower high that produced a new low.
- Price makes a high at 118, pulls back to 112, then rallies to 125. The 112 low produced a new high, so it is your key level.
- Price pulls back to 116 and bounces to 122, but fails to beat 125. The 116 low produced no new high, so 112 stays the key level.
- Price drops and closes at 110. By the rule, the uptrend is over.
The rule does not say a downtrend has started. A broken uptrend often turns into a range first, so think of three states: uptrend, no trend, downtrend.
If price makes a higher high but RSI makes a lower high, that bearish divergence suggests momentum is fading. Our guide to RSI divergence covers it. Treat it as a heads-up and let the structure break be the confirmation.
Where stops belong
A structure stop goes where your idea is proven wrong. With the key low at 112 and a buy at 118, a stop at 111 sits just under the level to allow for wicks and spread. Your risk is 7 points per unit. For a short, the stop goes a little above the key lower high.
- Let the stop decide the size. Adjust how many units you buy so a 7 point stop costs an amount you accept. The position size calculator does the maths.
- Check the reward. If the previous swing high is only 5 points above your entry and the stop is 7 below, you risk more than you can gain. See the risk reward ratio.
- Trail with structure. As new higher lows form, move the stop up under each one.
If the logical stop is too far for your account, skip the trade.
Timeframes and common mistakes
A daily chart can be in an uptrend while the 15 minute chart makes lower highs in a pullback. A common approach is to read the higher timeframe for direction and the lower one for timing.
- Marking too many swings. Keep only the clear ones.
- Treating every wick as a break. Stick to close-based or wick-based rules.
- Calling a reversal on one lower high. Wait for the key low to go.
- Ignoring news. A central bank decision can blow through structure in seconds. See how to read an economic calendar.
Common questions
01What is market structure in simple terms?
It is the sequence of swing highs and lows on a chart. Rising highs and lows show an uptrend, falling ones a downtrend, and flat ones a range.
02What are the four types of market structure in economics?
Perfect competition, monopolistic competition, oligopoly and monopoly. They describe how many sellers an industry has and how much control they have over price.
03Does market structure work on gold, forex and crypto?
Yes, the same highs and lows logic applies to any freely traded market and timeframe. Size your stop buffer to the asset's volatility.
How to automate market structure with AiTradely
The strategy builder can watch these conditions and send an alert when they line up.
- Set direction. Add "bullish market structure" on the 1d chart. For shorts, use "bearish market structure".
- Add the trigger. Add "change of character up" on the 1h chart, or "break of structure up" for continuation entries.
- Add a volume check. Add "volume above 1.5 times its average" on the 1h, then backtest the setup on history.
- Watch the trend-over level. The builder has no condition for the specific higher low behind the last high, so set a typed price alert, for example "alert me when price closes below 112 on the 1d".
When an alert fires, open a trade plan on the 1h timeframe and check that its stop sits a little below the key higher low. Compare it with the swings on your chart. You decide whether to take the trade and place every order yourself, and the AI never trades on its own.
Nothing here is financial advice. Structure levels can break suddenly on news or thin liquidity, and a stop placed beyond a swing point can still fill at a worse price than planned.
 AiTradelyYour AI trading analyst, in your pocketAI analysis for gold, forex and stocks. Build and backtest strategies, get signals, and trade from your own broker account.
 On your phoneScan for the app