
Bollinger Bands are on almost every chart, and they are misread more often than almost any other indicator — usually in the same way: a trader sees price touch the upper band and reads it as "overbought, time to sell." That is not what the bands say. This guide covers what they actually measure, how to read the squeeze, and the step-by-step method for using them without fighting a trend.
What Bollinger Bands actually measure
Bollinger Bands are three lines wrapped around price. The middle line is a moving average — the standard setting is 20 periods. The outer two are placed a set number of standard deviations above and below that average, normally two.
Standard deviation is a measure of how spread out recent prices have been. When price has been moving in a tight range, the deviation is small and the bands sit close together. When price has been swinging, the deviation is large and the bands spread apart.
That single fact explains most of the misreadings: the bands measure volatility, not direction. They widen and narrow based on how much price has been moving, and they do not know or care which way it goes next.
You will often read that about 95% of price action stays inside two standard deviations. That figure comes from a normal distribution, and market returns are not normally distributed — they have fatter tails, meaning big moves happen more often than the statistics predict. Treat the bands as a description of the recent range, not as a boundary the market has agreed to respect.
The three lines, and what each one tells you
| Line | What it is | What it tells you |
|---|---|---|
| Middle band | 20-period moving average | The short-term trend, and a common pullback target |
| Upper band | Average + 2 standard deviations | The top of the recent normal range |
| Lower band | Average − 2 standard deviations | The bottom of the recent normal range |
| Band width | Distance between the outer bands | How volatile the market has been — the whole point |
The middle band is the one most traders ignore, and it is the most useful of the three for reading trend: price holding above it during a pullback is a different situation from price cutting through it.
The squeeze — what the bands are best at
When the bands contract into a narrow channel, it is called a squeeze. Volatility has dried up: recent bars have been small and prices have clustered together.
Volatility tends to cycle. Quiet periods are followed by active ones, and active periods eventually settle down again. A squeeze is therefore a reasonable signal that a larger move is coming — the market has coiled.
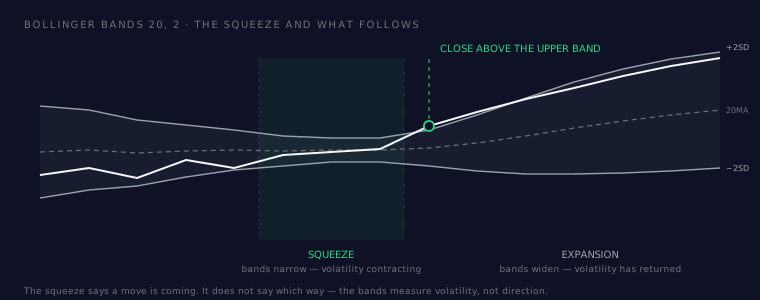
The trap is what happens next. The squeeze tells you a move is likely; it tells you nothing about direction. Traders who position before the break are guessing, and a squeeze that resolves against them tends to resolve fast, because the same volatility expansion that would have paid them is now working the other way. Waiting for the break costs you the first part of the move and removes the coin flip.
Walking the band
In a strong trend, price can ride along the upper band for a long stretch — bar after bar closing near or outside it. This is called walking the band, and it is the single most common way traders lose money with this indicator: they short each touch of the upper band, and the trend keeps going.
A touch of the upper band means price is at the top of its recent range. In a range-bound market, that is often where price turns. In a trending market, it is simply where a strong trend lives. The band did not change meaning — the market context did.
This is why the bands work far better with a second input that tells you which situation you are in. A trend-strength reading, the slope of the middle band, or a momentum indicator all serve that purpose.
How to read Bollinger Bands, step by step
- Look at the band width first, before anything else. Are the bands narrow or wide? That tells you which regime you are in.
- Check the middle band's slope. Rising means the short-term trend is up, flat means the market is ranging. This decides whether band touches are likely reversals or continuation.
- In a range — flat middle band — treat the outer bands as the edges of the range. Touches near them are where mean reversion tends to happen.
- In a trend — sloping middle band — stop reading the outer band as a reversal point. Use pullbacks to the middle band instead, and let the band walk.
- On a squeeze, wait for the resolution. Mark the level, and let the market pick a direction before you do.
- Confirm with something that is not price-derived. Volume works well here, because the bands and price are the same information twice.
Common mistakes
- Reading a band touch as a signal. The upper band is not a sell signal and the lower band is not a buy signal. They are the edges of the recent range.
- Trading the squeeze early. Direction is the one thing a squeeze cannot tell you.
- Ignoring the middle band. It carries the trend information, and it is the line most people never look at.
- Changing the settings until it looks right. Widening the bands to 2.5 standard deviations because two produced too many touches is curve-fitting the chart to a story you already believe.
- Using them alone. Bands describe volatility. They need a partner that describes direction or participation.
How AiTradely uses this
Bollinger Bands are one of the indicators AiTradely calculates for every asset on your watchlist, using the standard 20-period, two-standard-deviation setting. When you ask about an asset, the band position is already part of the read — you are not pasting a chart in and asking what it shows.
They are also available as a condition in the strategy builder. A rule can require that price closes below the lower band, above the upper band, or on either side of the middle band, and you can combine that with other conditions — so "price closed below the lower band and momentum is turning up" is a strategy you can define, backtest against historical data, and have checked automatically as new bars close.
That combination is the point. The bands on their own say how stretched price is; pairing them with a second condition is what turns an observation into something you can actually test.
Nothing here is financial advice. Bollinger Bands describe past volatility — they do not predict future prices, and no indicator setting removes the risk of loss.