Candlestick patterns are groups of one to three candles that show how buyers and sellers fought over a period, and they hint at whether a move may reverse, continue or stall. On their own they mean little. A hammer at a tested support level, after a long fall, on rising volume, deserves attention, while the same hammer in the middle of nowhere is just a candle.
How to read a candlestick chart first
Each candle records four prices: open, close, high and low. The thick body runs between the open and the close, bullish (green) if the close is higher and bearish (red) if lower. The thin wicks show prices reached but not held.
Say a stock opens at 100, rises to 106, drops to 97 and closes at 104. The body runs from 100 to 104, and the lower wick to 97 shows sellers pushed hard before buyers took it back.
Candlestick patterns grouped by what they suggest
You only need a handful of patterns, sorted by the message they carry. A pattern is not complete until the candle closes.
Reversal patterns: the move may be running out
These only make sense after a clear move. A bullish reversal needs a prior fall, a bearish one a prior rise.
Hammer. A small body near the top, a lower wick at least about twice the body, and little or no upper wick, after a decline. The long wick shows rejection of lower prices.
Shooting star. A small body near the bottom with a long upper wick, after a rise. It shows buyers were rejected.
Bullish and bearish engulfing. A second candle whose body completely covers the body of the first, in the opposite direction.
Morning star and evening star. Three candles: a long red candle, a small one showing selling is slowing, then a strong green candle closing past the midpoint of the first. The evening star is the bearish mirror after a rise. See the morning star candlestick pattern guide for detail.
Indecision and continuation patterns
A doji has an open and close that are equal or almost equal, so buyers and sellers ended level. After a strong trend it shows the winning side stopped making progress.
An inside bar sits entirely within the previous candle's range. In a trend it often marks a pause, and a close beyond its range in the trend direction suggests the move is resuming.
Why context decides whether candlestick patterns matter
The trend before it. A reversal pattern needs something to reverse. Look for lower highs and lower lows before a bullish pattern, higher highs and higher lows before a bearish one.
A key price level. Say a currency pair has bounced off 1.2000 twice this month. A hammer whose wick pokes to 1.1980 and closes back above 1.2000 shows support held again. The same hammer at 1.2140, with no history there, says much less. An indicator can add a second layer, such as RSI divergence behind a bullish engulfing.
Volume. A bullish engulfing candle on volume well above average suggests real buying stepped in. On thin volume it may be noise. Spot forex has no central volume figure, so many traders lean on levels there. See how to read trading volume.
Where the stop goes for each pattern
A pattern is a claim about the market, and the stop is where the claim is proven wrong, usually the extreme of the pattern itself.
| Pattern | Entry | Stop goes |
|---|---|---|
| Hammer | Above its high, after a close | Below the low wick |
| Shooting star | Below its low, after a close | Above the upper wick |
| Bullish engulfing | Above the engulfing high | Below the lower of the two lows |
| Morning star | Above the third candle's high | Below the middle candle's low |
| Doji or inside bar | Break of its high or low | Beyond the opposite end |
Many traders add a small buffer. If a hammer's low is 94, a stop at 93.5 on a buy at 100 risks 6.5 per unit. Accepting a loss of 130 means 20 units, and a position size calculator does this arithmetic for you. If the nearest resistance is at 104, you would risk 6.5 to make 4, which many traders skip. The risk reward ratio guide explains how to weigh that.
A step-by-step method for trading candlestick patterns
- Mark the trend and levels on the daily or 4-hour chart first.
- Wait for price to reach a marked level rather than hunting for patterns everywhere.
- Look for a pattern that fits the location: bullish reversals at support after a decline, bearish ones at resistance after a rise.
- Wait for the candle to close, then check volume and one indicator at most.
- Wait for confirmation on dojis and inside bars.
- Set the stop beyond the pattern's extreme, size the trade, and set a target at the next level.
Check the calendar too. A clean hammer minutes before a central bank decision can be erased by one news candle, as covered in how to read an economic calendar.
Candlestick patterns vs chart patterns
Candlestick patterns use one to three candles and help time an entry and a tight stop. Chart patterns such as double bottoms and triangles form over many candles and often mark the levels where candle patterns matter. A double bottom gives the level, and a morning star at the second bottom gives a possible entry.
Common questions
01What are the most important candlestick patterns for beginners?
Start with the hammer, shooting star, engulfing patterns, doji and morning or evening star. A few learned well beat dozens memorised.
02What does a doji candlestick mean?
The open and close were almost the same, so buyers and sellers finished level. It matters mainly after a strong trend or at a key level.
03How reliable are candlestick patterns?
No pattern works a fixed share of the time, and results vary by market and timeframe. Their value comes from context, confirmation and a defined stop.
How to automate candlestick patterns with AiTradely
Watching charts for every candle that reaches your level takes time, and most candles turn out to be nothing. The strategy builder can do the watching.
- Build a bullish setup on the 4h chart: price below the 50 EMA, a lower Bollinger Band touch, a bullish engulfing, hammer or morning star, and volume above 1.5 times its average. For the bearish mirror, use price above the 50 EMA, an upper band touch and a shooting star, bearish engulfing or evening star.
- Cover what the builder cannot see. It has no condition for the inside bar, so mark the confirmation price yourself and set a typed price level alert, such as EUR/USD closing above 1.2050 on the 4h.
- Backtest on history, adjust if it fires in sideways chop, then turn the alert on.
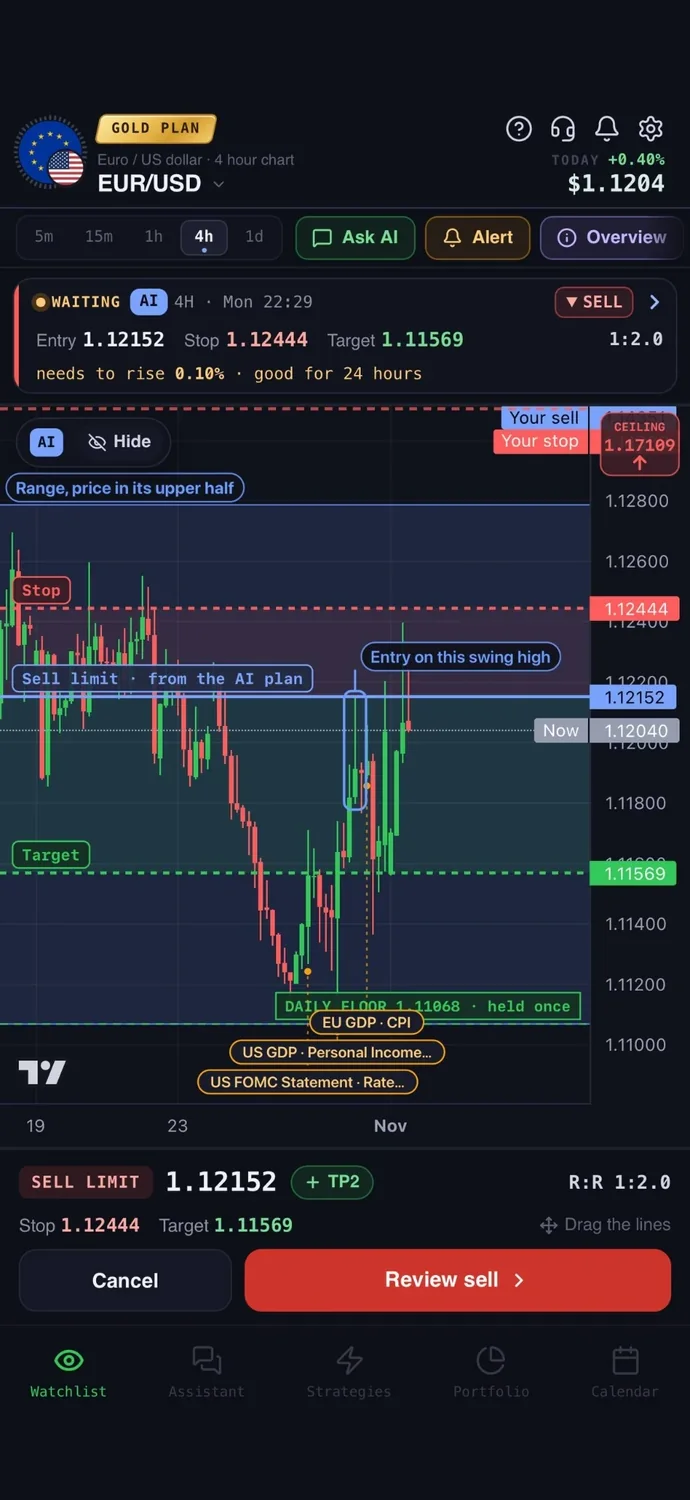
When an alert fires, open the trade plan for that asset on the 4h timeframe to see an entry, a stop and a target built from the chart, and compare the stop with the table above. The decision stays with you: you read the chart, check the calendar and place every order yourself.
Nothing here is financial advice. Candlestick patterns frequently fail, and price can move through a stop in fast markets or on news, causing losses larger than planned.
 AiTradelyYour AI trading analyst, in your pocketAI analysis for gold, forex and stocks. Build and backtest strategies, get signals, and trade from your own broker account.
 On your phoneScan for the app