Ask any trading forum whether repainting indicators are usable and you will get the same answer, stated with total confidence and zero evidence: repainting is cheating, wait for the candle to close, an alert that fires mid-bar is worthless.
We were in a position to check. Between 23 June and 18 August 2026, AiTradely resolved 3,390 signals fired by 179 strategies that our users built themselves, across 20 assets. Some fired while the candle was still forming. The rest fired after it closed. Same rules, same assets, same engine.
Short answer: once you control for when the signals fired, the gap between mid-bar and closed-bar alerts shrank to a difference we could not tell apart from chance. Most of the gap in a naive comparison is a calendar artifact, though a small repainting effect cannot be ruled out.
What repainting indicators actually do
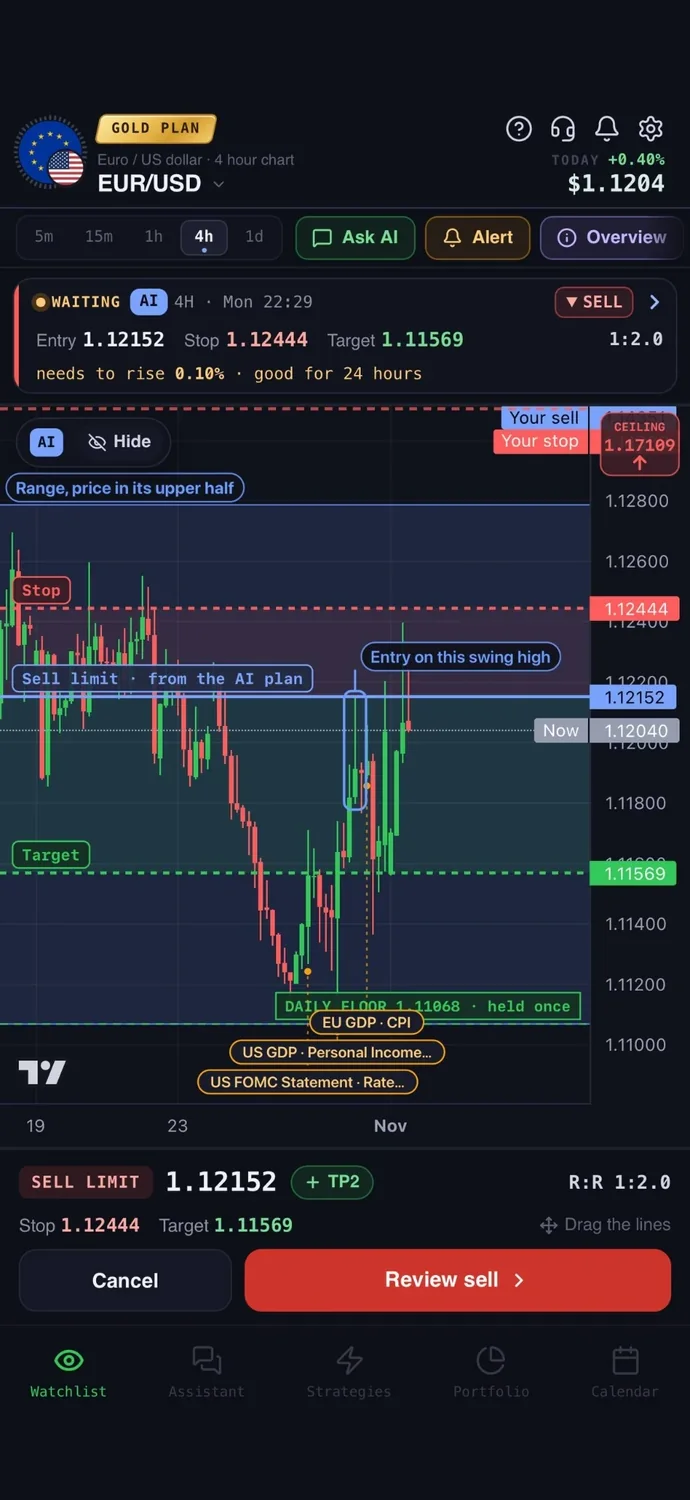
A rule like "RSI crosses below 30" can be true at 10:07 and false again at 10:15 when the candle closes, because the closing price moved. The alert you got at 10:07 described a bar that, in the end, never happened. That is repainting.
The objection is reasonable. The question is whether it costs you anything measurable, and almost nobody answers that with numbers.
The naive comparison, which is misleading
The mid-bar versus closed-bar comparison covers the 2,934 signals that ran on the 15-minute chart. The other 456 of the 3,390 ran on higher timeframes. Split every resolved 15-minute signal by whether it fired before or after its candle closed:
| Signals | Win rate | Mean R | |
|---|---|---|---|
| Fired mid-bar | 506 | 51.4% | +0.108 |
| Fired after close | 2,428 | 58.9% | +0.197 |
A 7.5 point win-rate gap. Waiting for the close looks worth 7.5 points. That conclusion is overstated, and the way it is overstated is worth more than the finding itself.
The confound
Mid-bar fires are not spread evenly across the sample. They sit almost entirely in the last two weeks:
| Week beginning | Signals | Share firing mid-bar |
|---|---|---|
| 6 Jul | 43 | 2% |
| 13 Jul | 256 | 3% |
| 20 Jul | 395 | 2% |
| 27 Jul | 492 | 2% |
| 3 Aug | 528 | 0% |
| 10 Aug | 932 | 33% |
| 17 Aug | 288 | 60% |
The weekly table adds up to the same 2,934 15-minute signals. It starts at 6 Jul because that is the first week in which 15-minute signals appear in the resolved sample, even though the full sample window opens on 23 June.
482 of the 506 mid-bar signals happened after 10 August. So the "mid-bar" group is really "signals from the second week of August" and the "closed" group is mostly "signals from July." July was kinder than August. That explains a large part of the 7.5 points, though not all of it.
This is a very common error in trading statistics: two groups get compared, they differ on something other than the variable of interest, and the difference is credited to the variable the author already cared about.
The controlled comparison
Restrict to 10 August onward, the only window where both kinds of signal occur together in volume:
| Signals | Win rate | Mean R | |
|---|---|---|---|
| Fired mid-bar | 482 | 51.2% | +0.095 |
| Fired after close | 738 | 54.9% | +0.118 |
The difference in mean R is 0.023R in favour of waiting (closed-bar minus mid-bar), with a 95% confidence interval of [-0.10, +0.15]. On win rate, a two-proportion z test gives z = 1.24. Neither is statistically significant. The interval contains zero, and outcomes in both directions.
In plain terms: we could not detect a difference. The interval's half-width is about 0.125R, so only gaps of roughly 0.18R or more would show up reliably. The remaining 3.7 points of win rate is well inside what chance produces at this sample size.
What this does not prove
A null result is not proof of no effect. With 482 and 738 signals, the smallest difference we could reliably detect is roughly 0.18R. So the honest claim is narrow: if waiting for candle close has an edge, it is probably smaller than 0.18R per trade and not visible in 1,220 signals.
Other limits:
- Outcomes are resolved by replaying the candle path after the signal and checking whether the target or the stop was hit first inside the strategy's horizon. Spread, commission and slippage are not modelled. Real fills would be worse for both groups.
- 20 assets over eight weeks is one broad market regime, not a full cycle.
- Wins are recorded at the strategy's planned reward-to-risk, losses at exactly -1R. That is a clean accounting convention, not what a discretionary trader experiences.
- These are strategies real users wrote, not a curated set.
- The sample is concentrated. The 3,390 signals come from 179 strategies owned by 55 accounts, and the eight most active owners account for 60.5% of all signals. Repeated fires of one rule on one asset are not independent, so the true intervals are wider than quoted. Treat them as a floor on the uncertainty.
A timeframe difference worth noting, with caveats
Running the same comparison across timeframes gives this:
| Timeframe | Signals | Win rate | Mean R |
|---|---|---|---|
| 15m | 2,934 | 57.6% | +0.181 |
| 1h | 355 | 67.6% | +0.377 |
| 4h | 90 | 50.0% | +0.094 |
The table leaves out the daily bucket, which holds the remaining 11 signals (2,934 + 355 + 90 + 11 = 3,390). The 4-hour and daily buckets are too small to say anything about.
The 1-hour signals showed a higher mean R than the 15-minute ones in this sample, by 0.196R per trade. But 355 signals concentrated among a few owners may not hold up, and the gap cannot be attributed to timeframe alone. It is a lead to check, not a conclusion.
Gating 15-minute alerts until the close would delay every alert by up to fifteen minutes to buy an effect we cannot measure.
How to test repainting indicators yourself
Split your own results by whether the signal fired mid-bar, then check that both groups cover the same calendar period. That last step is the one everyone skips, and it shaped this question.
For the mechanics behind the numbers, see our guides on risk-reward ratio and what RSI is and how to use it. The position size calculator turns an R figure into a lot size.
Common questions
01Are repainting indicators always bad?
Not necessarily. In our data, mid-bar and closed-bar alerts showed no detectable difference once the calendar period was matched, though the test could not rule out a small effect.
02What does it mean when an indicator repaints?
Its value or signal changes while the candle is still open, so an alert that fired can disappear by the close.
03Should I always wait for the candle to close?
Waiting avoids false mid-bar alerts, but our data did not show it improved results. It does delay your entry, so it is a trade-off you choose.
04Does timeframe matter more than repainting?
In our sample, the 1-hour signals showed a higher mean R than the 15-minute ones, but the sample is concentrated, so we cannot attribute that to timeframe alone.
Putting it into practice
Instead of trusting a forum verdict, measure your own rule on your own timeframe and compare like with like.
In the AiTradely app, the strategy builder lets you set conditions such as RSI levels, backtest them on history and get an alert when they fire. A sensible next step is to build one rule, run it on the 15m and the 1h, and see how the two compare before you place any trade yourself.
Nothing here is financial advice. Results from a short, concentrated sample of user strategies can look convincing and still fail to repeat in a different market.
 AiTradelyYour AI trading analyst, in your pocketAI analysis for gold, forex and stocks. Build and backtest strategies, get signals, and trade from your own broker account.
 On your phoneScan for the app