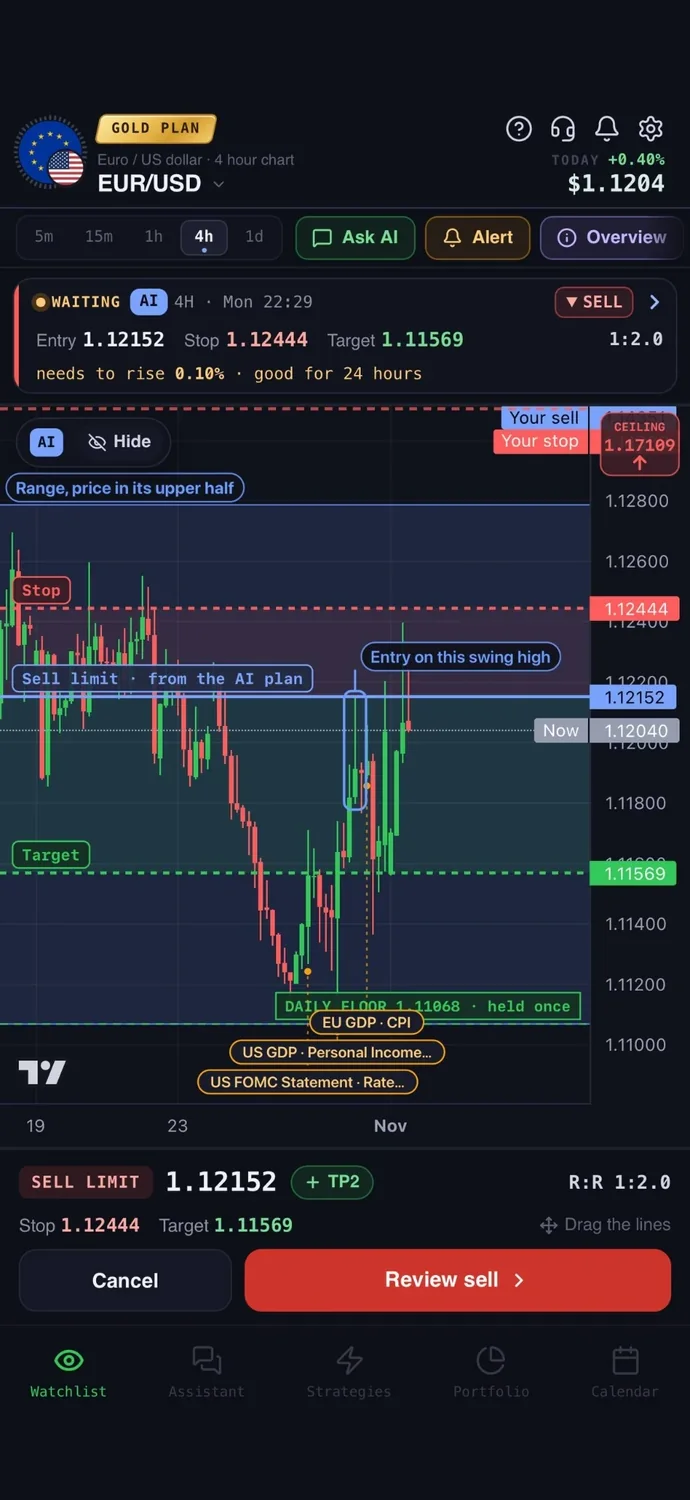
The head and shoulders pattern is a reversal chart pattern: three peaks where the middle one (the head) is the highest and the two outer ones (the shoulders) are lower and roughly equal. When price closes below the line joining the two lows between those peaks, called the neckline, it suggests an uptrend may be ending. You enter on that break, place your stop above the right shoulder, and aim for a target equal to the height of the head measured down from the neckline. The inverse version works the same way, upside down, at the end of a downtrend.
What the head and shoulders pattern shows
The pattern is a picture of buyers slowly running out of strength. Price makes a high (left shoulder) and pulls back. Buyers push to a higher high (the head) and price falls back to about the same level. Buyers try again but fail to reach the head (right shoulder). Then price falls through the neckline, the support line under the two pullback lows.
The right shoulder is the first lower high of the trend, and the neckline break gives the first lower low. That is how an uptrend turns over. For more, see our guide to market structure.
How to spot a valid head and shoulders chart pattern
Most shapes that look like a head and shoulders are noise. Check these first:
- There must be a prior uptrend. Three bumps in a sideways range are not a reversal pattern.
- The head must be clearly higher than both shoulders. If the peaks are almost level, it is a triple top or a range.
- The shoulders should be roughly balanced in height and in time.
- The neckline must be drawable. Connect the low after the left shoulder to the low after the head. It can be flat or slightly sloped.
- It is not a pattern until the neckline breaks. Many right shoulders turn into new highs instead.
The volume check most pages skip
Volume is how much was traded in a period, and it shows conviction behind a move. Our guide on how to read trading volume covers the basics. In a textbook pattern, volume is highest on the left shoulder rally, lower on the head, lower again on the right shoulder, then rises on the neckline break.
A break on thin volume is easier to reverse. In spot forex and some gold charts you see tick volume (the count of price changes), a rougher proxy, so weigh it less.
Momentum can add a second check. If price makes a higher high at the head while RSI makes a lower high, that is bearish divergence. See RSI divergence.
Entry, stop and target: a worked example
Use round, hypothetical numbers. A stock rallies to 110 (left shoulder), pulls back to 100, rallies to 120 (head), pulls back to 100 again, then rallies only to 111 (right shoulder) and falls. The neckline is flat at 100.
- Wait for a candle to close below the neckline. A wick through 100 that closes back above does not count. Say a candle closes at 99.
- Measure the height. Head minus neckline: 120 minus 100 is 20.
- Project the target. Neckline minus height: 100 minus 20 is 80.
- Place the stop just above the right shoulder, say 112.
- Check the risk and reward. Entry 99, stop 112: risk 13. Target 80: reward 19. That is about 1.5 to 1. Our guide to the risk reward ratio explains why this matters.
- Size the position. With a 10,000 account risking 1% (100), you can trade about 100 divided by 13, so roughly 7 shares. A position size calculator does this for you.
A retest entry is the alternative. After the break, price often bounces back to test the old neckline from below. Say it rallies back to 100 and stalls. You sell at 99.5 with a stop at 104: risk 4.5, reward 19.5, more than 4 to 1. The trade-off is that strong moves give no retest and you miss the trade.
If the neckline slopes, project the height from the point where price actually broke. Treat the target as a zone, not a promise.
The inverse head and shoulders pattern
The inverse head and shoulders is the bullish mirror image, forming after a downtrend. Say price falls to 90, bounces to 100, falls to 80 (head), bounces to 100, then dips only to 89 and turns up. The neckline is 100.
Entry is a close above 100, say 101. The height is 20, so the target is 120. The stop goes just below the right shoulder, say 88. Volume matters even more here, because rallies need fuel.
Why patterns fail, and the mistakes that cost the most
No pattern works every time, so plan for failure. Warning signs are a close back above the neckline within a few candles, a breakout on small volume, or price rising above the right shoulder, which invalidates the setup.
- Forcing the shape. If you have to squint, it is not there.
- Ignoring the bigger trend. A 5-minute pattern inside a strong daily uptrend often yields only a small pullback.
- Trading through news. Check the economic calendar first.
- Moving the stop once price clears the right shoulder.
Candlestick patterns such as the morning star can add evidence inside a shoulder, but they do not replace the neckline break.
Common questions
01Is the head and shoulders pattern bullish or bearish?
The regular pattern is bearish and forms at the top of an uptrend. The inverse is bullish and forms at the bottom of a downtrend.
02How reliable is the head and shoulders pattern?
It fails often enough that a stop is essential. It tends to be cleaner with a clear prior trend, fading volume into the right shoulder and a high-volume neckline break.
03How do you calculate the head and shoulders target?
Measure from the top of the head to the neckline, then subtract that distance from the breakout point. For the inverse, add it.
04What timeframe is best for head and shoulders?
It appears on every timeframe. Patterns on 4-hour and daily charts tend to be cleaner than those on very short charts, which give more false breaks.
Putting it into practice
The builder in AiTradely has no condition for chart patterns, so you draw the neckline yourself. With the neckline at 100, you can type a price alert such as "alert me when this stock closes below 100 on the 4h". You can also build a rule-based version: a change of character down plus volume above 1.5 times its average, then backtest it on history.
When an alert fires, you check the chart, compare a 4h trade plan with your own measured move, and decide for yourself. If you go ahead, you place the order yourself, including from the app on your own cTrader or MetaTrader 5 account. The AI never trades on its own.
Nothing here is financial advice. Head and shoulders patterns can break the neckline and then reverse sharply, so always trade with a stop and a position size you can afford to lose.
 AiTradelyYour AI trading analyst, in your pocketAI analysis for gold, forex and stocks. Build and backtest strategies, get signals, and trade from your own broker account.
 On your phoneScan for the app