Forex chart patterns are shapes that price draws across many candles, such as double tops, triangles and flags. Traders use them to frame a scenario, then check the structure and the breakout to see whether that scenario is still valid or has failed. A pattern is a working hypothesis about what price might do next, not a forecast.
What Are Forex Chart Patterns?
A chart pattern is a shape formed by the price line over a series of candles, often dozens of them. Common chart pattern definitions describe it as a shape that helps suggest what price might do next, based on what it has done before. No pattern guarantees that the market will move in the expected direction.
This is the main difference from candlestick patterns, which are built from one to three candles and describe a short burst of buying or selling. A chart pattern describes the larger structure those candles build together.
Patterns are usually sorted into three groups:
- Reversal patterns suggest a trend may be changing direction, for example a double top after a rise.
- Continuation patterns suggest a pause inside a trend, for example a flag.
- Patterns with no set direction can break either way. A symmetrical triangle with no clear trend before it is a typical case.
Nearly every pattern is drawn from swing highs and swing lows. A swing high is a peak with lower prices on both sides. A swing low is a trough with higher prices on both sides. If you want the basics of how these points form trends and breaks, read our guide to market structure. The move that came before the pattern matters, because a reversal pattern needs something to reverse.
Reversal Patterns: Double Tops, Double Bottoms and Head and Shoulders
Reversal patterns try to mark the point where one side of the market loses control. They need an existing trend. A double top in the middle of a sideways range is just a range.
Double Tops and Double Bottoms
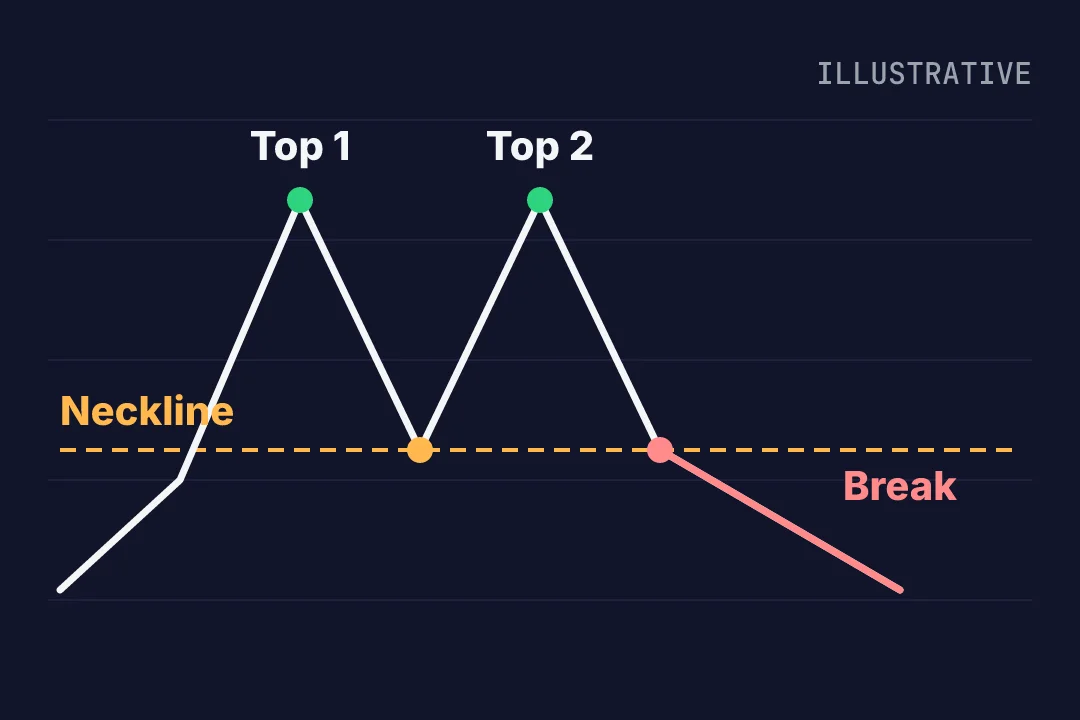
A double top appears after a rise. Price makes a peak, pulls back to a low, rises again to a similar peak, and fails to go higher. The low between the two peaks sets the neckline: a horizontal line drawn through that low. The neckline is the level that decides whether the pattern is finished.
A double bottom is the mirror image after a fall. Two similar lows, a high between them, and a neckline through that high.
Two touches of a level are not a completed reversal. They are a pattern that is still forming. In this guide we use one teaching rule for confirmation: a candle closes beyond the neckline. For a double top that means a close below it. For a double bottom, a close above it. Other traders use other rules.
So keep two states apart:
- Forming: two peaks or lows are in place, the neckline has not closed through.
- Completed: a candle has closed beyond the neckline.
The two peaks do not need to be exactly equal, and there is no fixed pip tolerance that makes a double top valid. They should look similar enough that most traders would draw the same line.
Head and Shoulders in Brief
A head and shoulders has three peaks. The middle one, the head, is the highest. The two outside peaks, the shoulders, are lower and roughly similar. A neckline joins the lows between the peaks. When price closes below it, the pattern is read as a possible shift from up to down. The inverse version turns it upside down after a fall: three lows with the middle one deepest, and a close above the neckline as the possible shift from down to up.
It is the same idea as the double top, with one more peak. For measuring, entries and stops, see our full guide to the head and shoulders pattern.
Continuation Patterns: Triangles and Flags
Continuation patterns show price pausing inside a trend. The usual expectation is that the old trend resumes, but that is an expectation, not a result. Any of them can break the other way.
Ascending, Descending and Symmetrical Triangles
A triangle is a squeeze between two boundary lines; what differs is their shape.
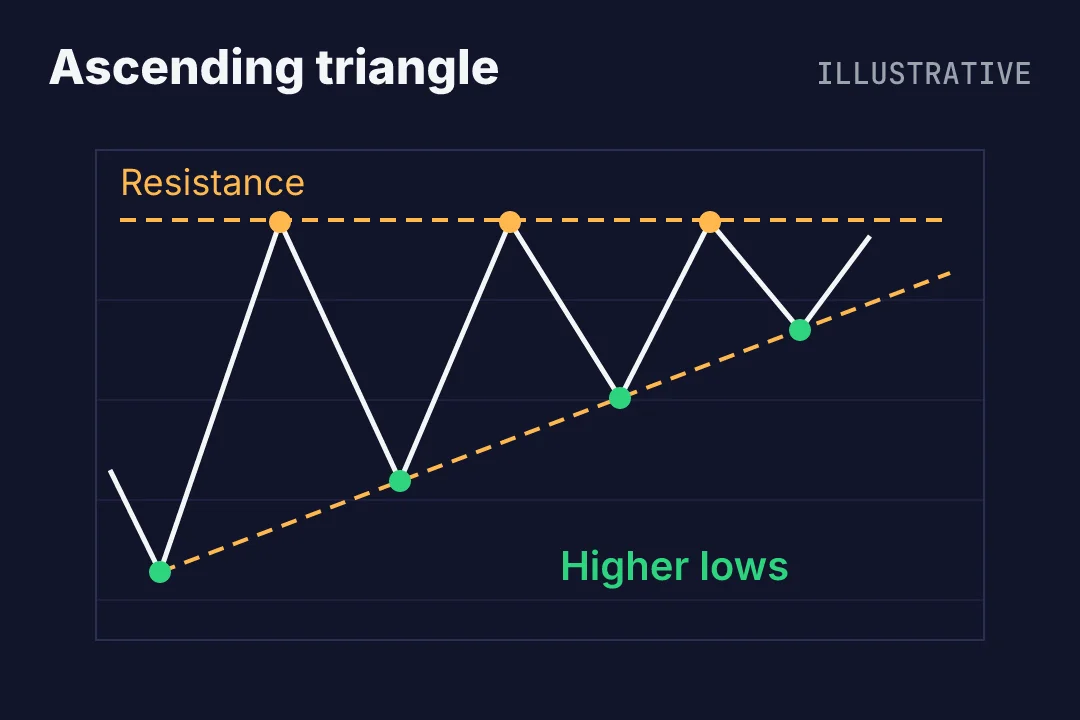
- Ascending triangle: a flat resistance line on top and rising lows underneath.
- Descending triangle: a flat support line on the bottom and falling highs above.
- Symmetrical triangle: both lines slope towards each other, with lower highs and higher lows.
The table compares them with the reversal patterns above.
| Pattern | Typical features | What supports the scenario | What puts it in doubt |
|---|---|---|---|
| Double top | Two similar peaks after a rise, a low between them | A candle closes below the neckline | Price closes back above the neckline or above the peaks |
| Double bottom | Two similar lows after a fall, a high between them | A candle closes above the neckline | Price closes back below the neckline or below the lows |
| Head and shoulders | Three peaks, the middle one highest | A close below the neckline | A close back above the neckline or the right shoulder |
| Ascending triangle | Flat resistance, rising lows | A close above the flat resistance | A close below the rising support line |
| Descending triangle | Flat support, falling highs | A close below the flat support | A close above the falling resistance line |
| Symmetrical triangle | Converging sloping lines | A close beyond either line, read with the prior trend | A move out of one side that quickly returns inside |
| Bull flag | Sharp rise, then a short pullback in a small channel | A close above the top of the channel | A close below the channel low |
| Bear flag | Sharp fall, then a short bounce in a small channel | A close below the bottom of the channel | A close above the channel high |
Ascending and descending triangles are usually expected to break in the trend direction, but neither is certain. A symmetrical triangle is the most open: plan for a break up or down. Not every squeeze is a continuation; sometimes it is a pause before a reversal.
Bull Flags and Bear Flags
A bull flag starts with a sharp, strong rise, often called the pole. Then price consolidates for a shorter time, usually in a small channel that tilts against the rise. A close above the top of the channel is the usual sign the rise may resume.
A bear flag mirrors this. A sharp fall, then a small channel that drifts up, and a close below its lower edge.
To tell a flag from a triangle, look at the lines and the context. A flag has two roughly parallel lines and follows a clear, sharp move. A triangle has lines that converge, and it does not need a pole before it. Wedges, pennants and other variations exist, but the flag and the three triangles are enough to start with.
How to Check a Breakout and Recognise a False Break
A breakout is price moving beyond a boundary of the pattern. A false break is a breakout that does not hold. Here is a simple order of work:
- Note the pair, the timeframe and the move before the pattern.
- Draw the lines from highs and lows already on the chart. Do not move them afterwards to fit what price did.
- Wait for your chosen confirmation. In this guide that is a candle close beyond the line.
- Write down the other scenario. Decide which price movement would show that you were wrong.
A wick beyond a line and a close beyond a line are different events. A wick only means price touched the area briefly. A close means the period ended there, which is why many traders wait for it.
After a break, price sometimes returns to test the broken line from the other side. This is a retest. It can happen, but it is not required, and it does not make a trade successful.
Invalidation is the price at which your scenario is no longer valid. If a double top breaks below the neckline and then closes back above it, the move may have been a false break, and the bearish idea is in doubt.
Costs and news also matter. The spread, any commission and possible slippage (getting a worse price than the one you wanted) all cut into a trade, and a news release can push price through a line within seconds.
Volume needs care in spot forex. The market is not traded on one exchange, so there is no single volume figure for all trades. Many charts show tick volume, which counts price updates and depends on the data feed. It shows how fast price is moving, not all currency deals, so no volume level proves a pattern valid.
A Hypothetical EUR/USD Double Top Example
This example uses made-up numbers on an H1 chart, meaning one candle per hour. It is not market data and not a real trade.
Say EUR/USD rises, then makes a peak near 1.1060. Price pulls back to a low at 1.1000, then rallies again to a second peak near 1.1060 and fails. The neckline sits at 1.1000. At this point the pattern is still forming.
Later, an H1 candle closes at 1.0990, below the neckline. By our teaching rule, the double top is now completed.
The pattern height is the distance from the peaks to the neckline: 1.1060 minus 1.1000 is 0.0060, or 60 pips. A measured move projects that height down from the neckline: 1.1000 minus 0.0060 gives 1.0940. This is an illustration of the method, not a required target and not an observed result.
From the close at 1.0990 to 1.0940 is 50 pips before costs, not 60, because part of the move had happened by the close. Also, a candle close is not a guaranteed fill price. An order placed after that close could be filled higher or lower.
Now the alternative. If price returns and closes above 1.1000, the break below the neckline did not hold, and the double top idea is in doubt. The cancellation point might sit just above the neckline or above the second peak, depending on the plan.
Weighing the possible target against the distance to that cancellation point is what the risk/reward ratio is for. There is no universal percentage of the account to risk. And planned risk is not a guaranteed maximum loss: an ordinary stop-loss order can fill at a worse price than the one set, especially around news.
A Forex Chart Pattern Checklist
Before you act on any shape, go through these points:
- Context: pair, timeframe and the move before the pattern.
- Boundaries: lines drawn from existing highs and lows, not adjusted later.
- Status: forming or completed.
- Confirmation: the close beyond the line, as you defined it.
- Cancellation: the price that shows the scenario was wrong.
- Costs and news: spread, commission, slippage and scheduled releases.
A recognisable shape alone is not enough because many shapes can be drawn on random price movement, the same shape breaks both ways, and the shape says nothing about costs or timing.
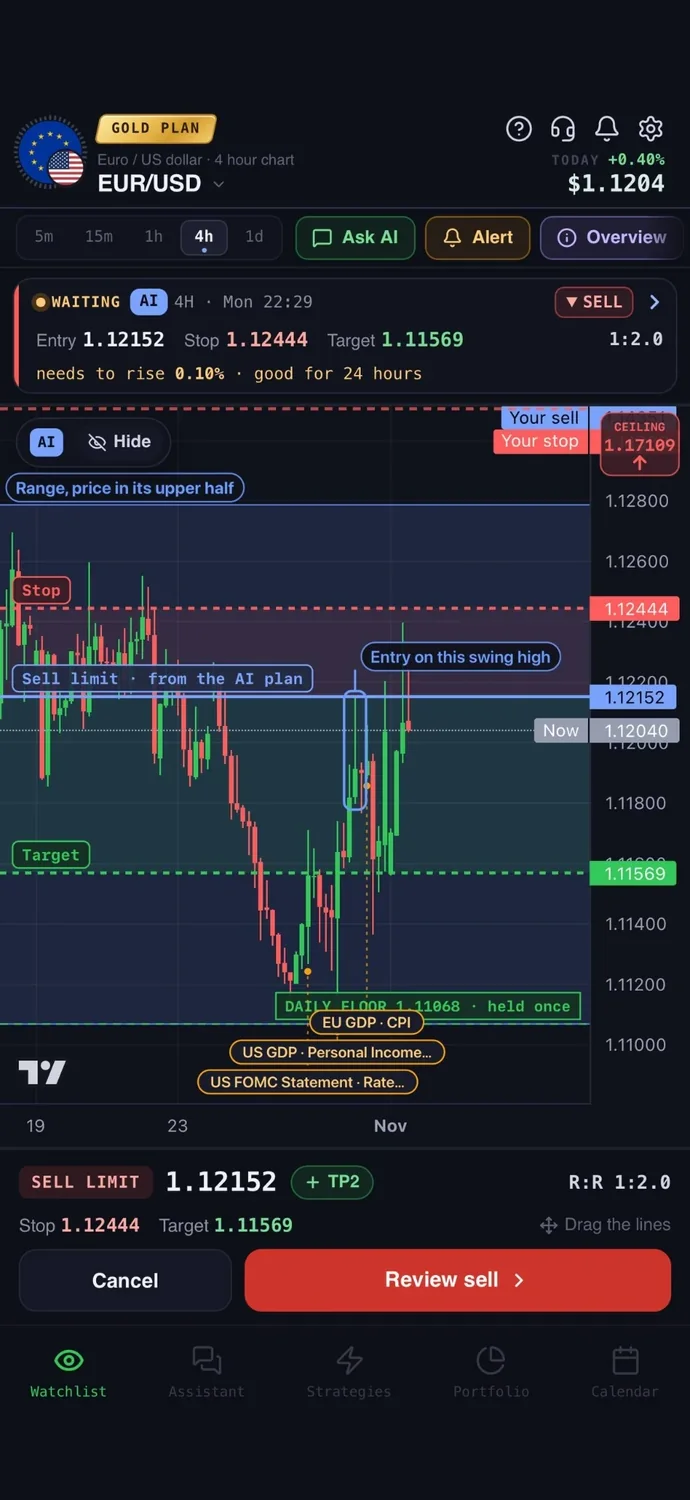
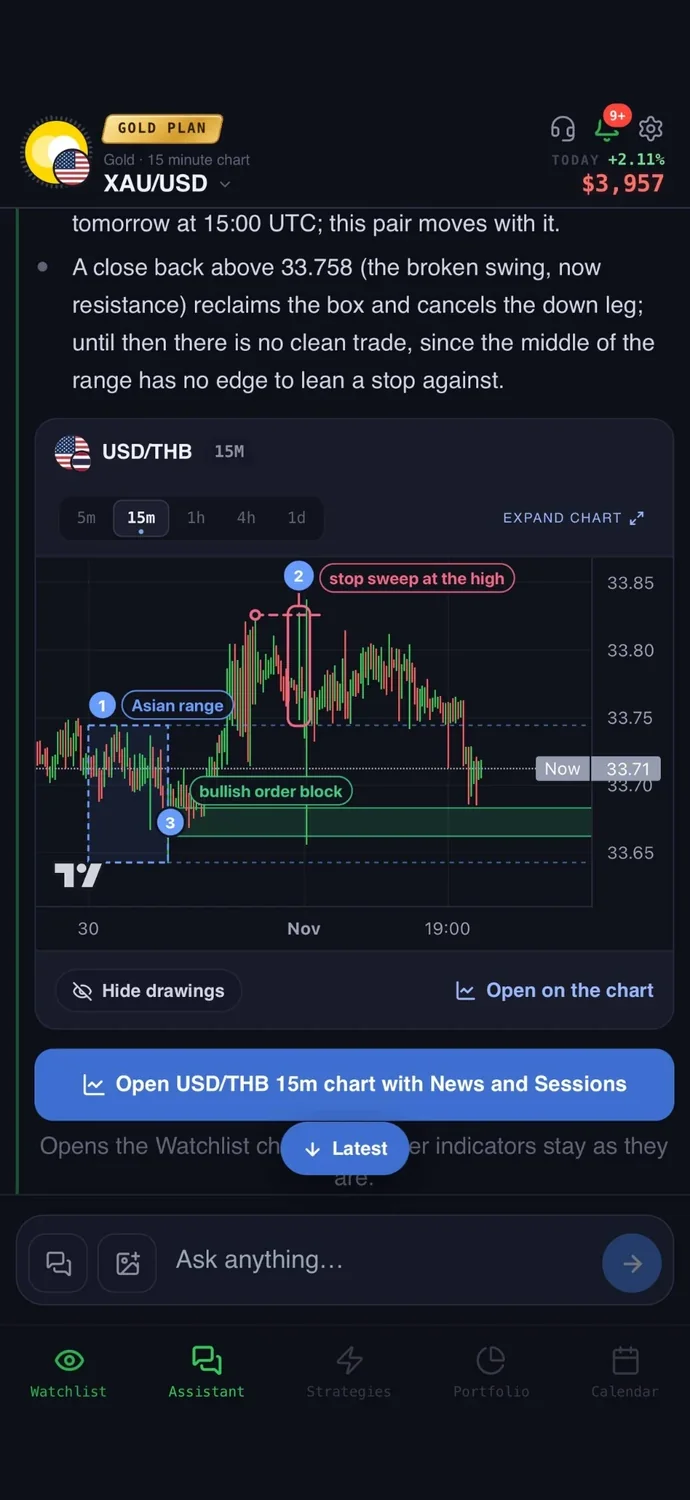
In the AiTradely app, you can ask the AI assistant about a pair and read its daily analysis, with the reasoning written out, as an extra view next to your own chart work. You can also build an alert on a typed price level, such as a close below your neckline on the 1h chart, so the app tells you when the level is hit and you decide what to do next.
Nothing here is financial advice. Chart patterns are drawn by eye, so two traders can read the same chart differently, and a pattern that looks complete can still fail.
 AiTradelyYour AI trading analyst, in your pocketAI analysis for gold, forex and stocks. Build and backtest strategies, get signals, and trade from your own broker account.
 On your phoneScan for the app