The morning star candlestick pattern is a three-candle shape that can appear at the end of a downtrend: a long bearish candle, a small candle, then a bullish candle that closes well into the first candle's body. To identify it, you check the move before it, each of the three candles and where the third one closes. A completed pattern describes a possible reversal, not a ready-made decision to buy.
What Is a Morning Star Candlestick Pattern?
A morning star is a bullish reversal pattern of three candles that forms after prices have been falling. It suggests selling may be fading. It needs a prior decline, because a reversal needs a downtrend to reverse.
Each candle has an open (the first price of the period) and a close (the last price). The thick part between them is the body. The thin lines above and below are the wicks, or shadows, marking the highest and lowest prices reached. A bullish candle closes above its open, a bearish candle below it.
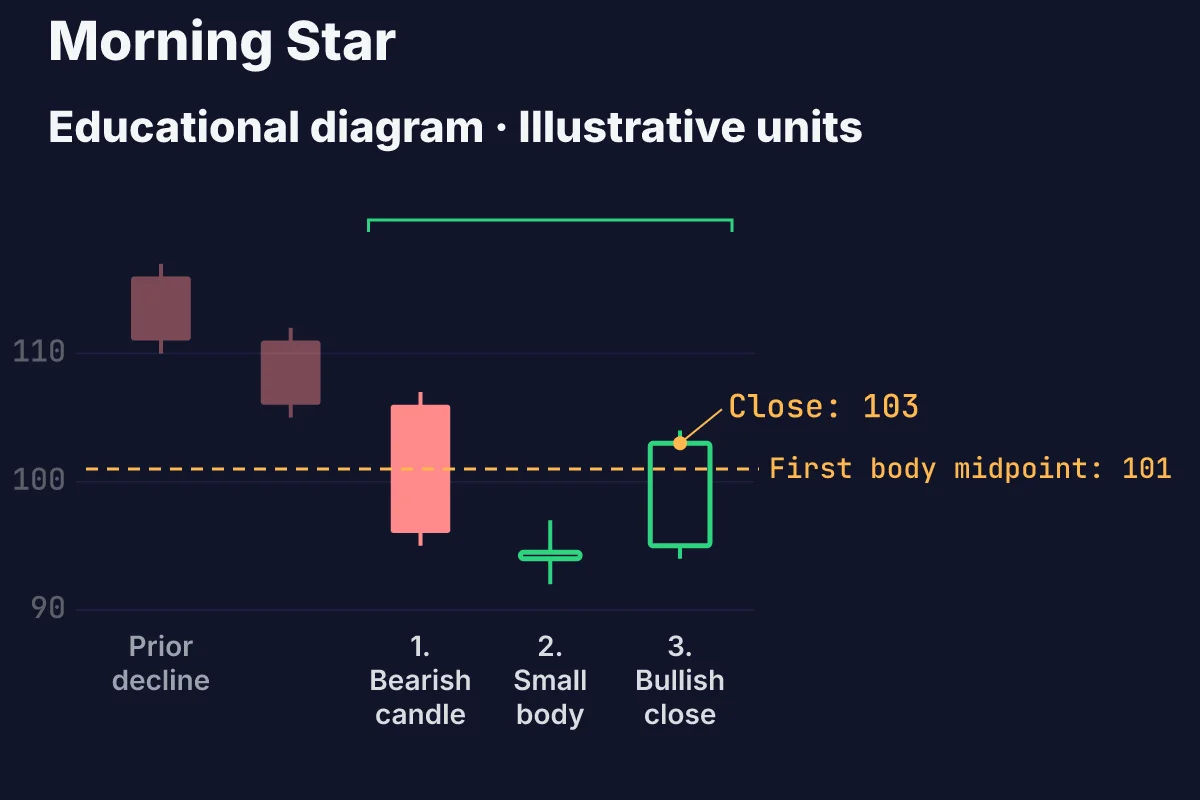
The three candles are three consecutive periods of your chart, not necessarily three days: three hours on a 1-hour chart, for example. The cover diagram labels them: a prior decline, then 1. Bearish candle, 2. Small body and 3. Bullish close. Not every red, small, green sequence is a morning star: each part has to pass a check.
How to Identify the Pattern Step by Step
This guide uses one definition throughout, based on these Morning Star recognition criteria: a long bearish first candle continuing a downtrend, a short second candle that gaps down from it, and a bullish third candle closing above the first candle's midpoint. Work through the four checks in order.
1. Find the Prior Downtrend
Look left of the three candles first. A downtrend is a stretch where price keeps making lower highs and lower lows, or stays below a moving average you use to judge direction.
The same shape after a rise is not reversing a decline, so it fails this condition. Inside a sideways range, where price bounces between a floor and a ceiling, there is no clear decline to reverse either.
There is no universal number of falling candles required. Pick your own rule, such as lower highs and lows over the recent swing, and apply it consistently.
2. Check the First and Second Candles
The first candle should have a long bearish body compared with its neighbours, showing sellers still in control. In the cover diagram it opens at 106 and closes at 96, a body of 10 units.
The second candle should have a small body of either colour. When its open and close are almost equal, it is a doji, a cross-shaped candle that shows indecision. That variant is often called a morning doji star, as described in this overview of the Morning Star and Morning Doji Star. A doji is one possible version, not a requirement.
Measure the body, not the full range with wicks. In the example the second candle opens at 94 and closes at 94.5, a half-unit body, even though its range runs from 92 to 97. No fixed percentage defines small: compare it with the first and third candles.
3. Wait for the Third Candle to Close
The third candle must be bullish and close above the midpoint of the first candle's body, halfway between its open and close. Using the cover diagram's values:
- First candle open: 106. First candle close: 96.
- Midpoint: (106 + 96) / 2 = 101.
- Third candle close: 103.
- 103 is above 101, so this check passes.
What counts is the close, not the top of the upper wick: a third candle can spike to 104 and still close at 100, which fails. Until the third candle closes, the pattern is not complete. These are invented teaching units, not real prices.
Confirmation has two meanings, so keep them apart. The closed third candle completes the pattern under this checklist. Some traders then look for further evidence, such as the next candles holding higher. That second step is part of judging the scenario, not a fixed rule, and it guarantees no rise.
4. Check How Your Chart Treats Gaps
A gap is empty space between one candle and the next. In the classic example the second candle's body gaps below the first: the first closes at 96, the second opens at 94. The wicks still overlap: first low 95, second high 97.
Definitions differ between sources and charting tools. Some require a body gap, some do not. Some use a stricter close: the third candle must finish above the whole first body, here above 106, so the example close of 103 would not qualify. This guide sticks to the midpoint rule in every example.
On charts where each candle opens at or near the previous close, a body gap may not appear. A similar sequence without one is a looser reading, not automatically the same pattern. If you use a built-in pattern scanner, check which definition it uses.
Morning Star vs Similar Candlestick Patterns
Three patterns share the same three-candle rhythm. They differ in the direction of the prior move and the role of the middle candle.
| Pattern | Prior move | Key difference |
|---|---|---|
| Morning Star | Downtrend | Long bearish candle, small second body of either colour, bullish third candle closing above the first body's midpoint |
| Morning Doji Star | Downtrend | Same structure, but the middle candle is a doji with almost no body |
| Evening Star | Uptrend | Mirror image: long bullish candle, small second body, bearish third candle closing below the first body's midpoint |
The morning star vs evening star comparison comes down to direction: one follows a decline and points to a possible bullish turn, the other follows a rise and a possible bearish turn, as this explainer on the Morning Star and Evening Star sets out.
Lookalikes That Do Not Meet the Checklist
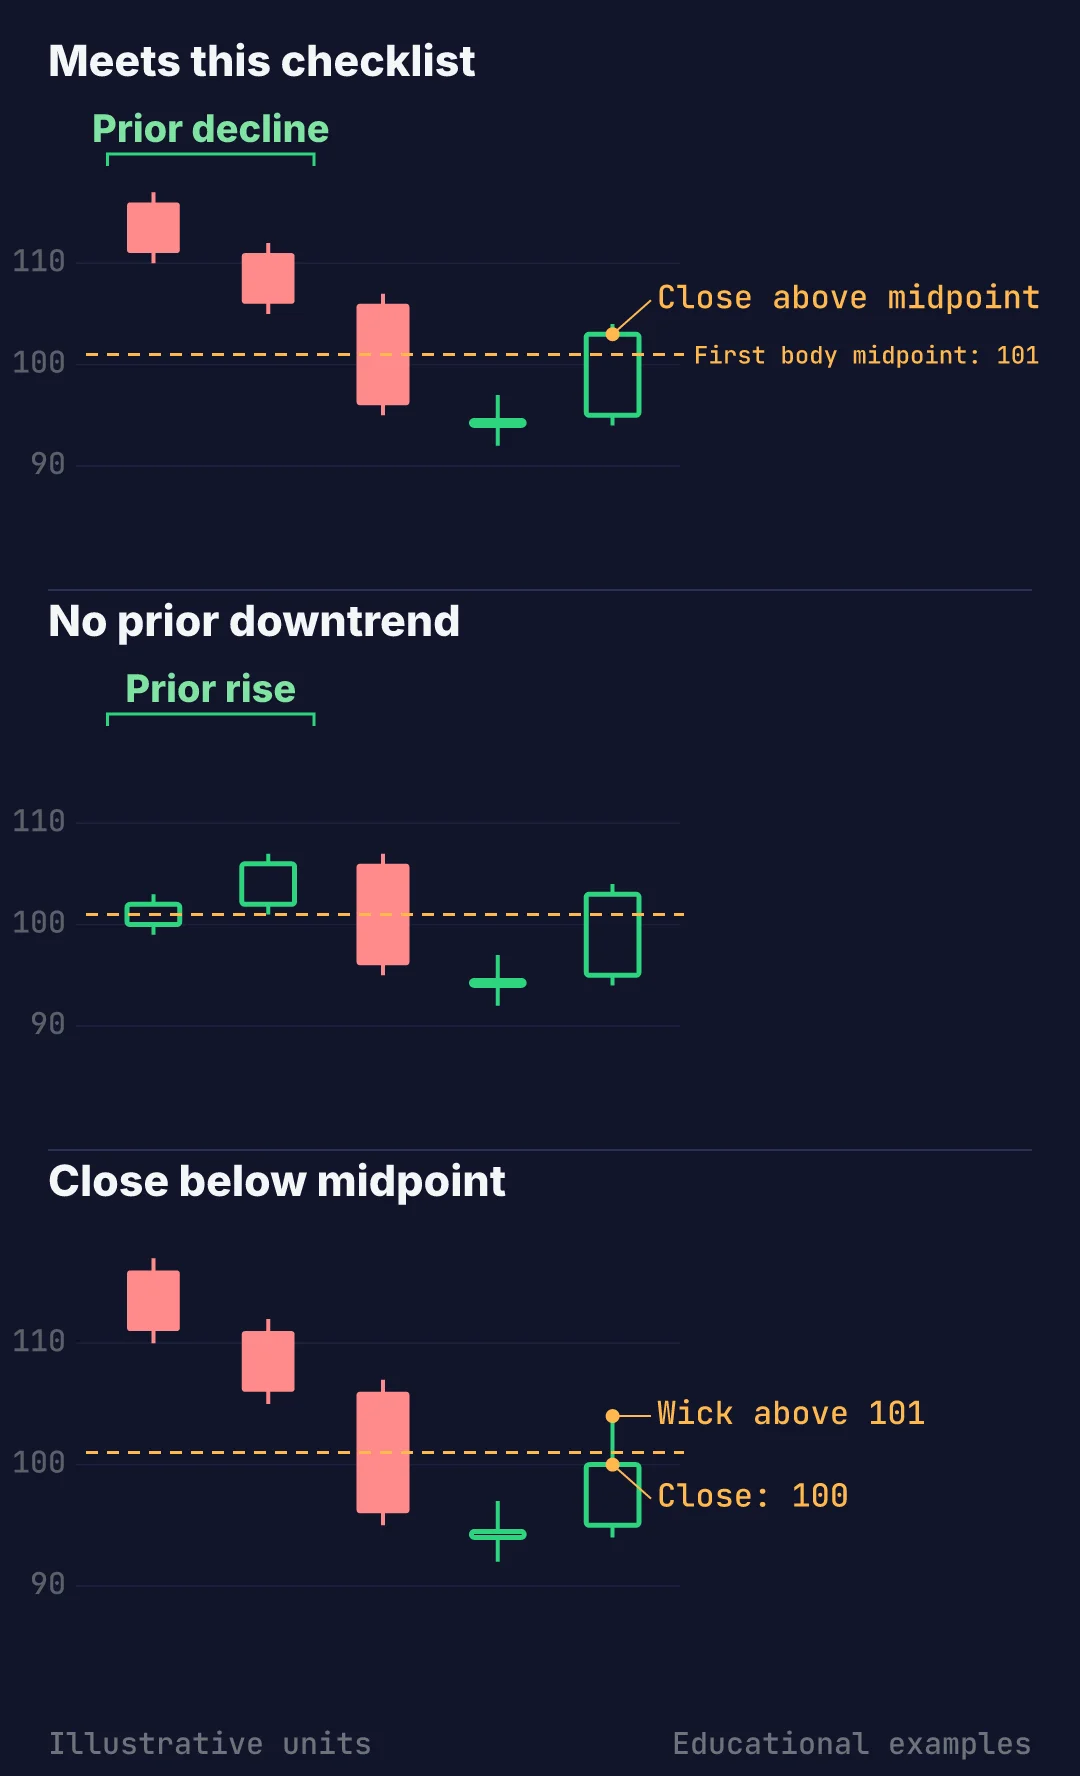
The diagram shows three invented cases with the same first body midpoint of 101.
Panel A: meets this checklist. A prior decline, a long bearish first candle, a small second body and a third candle closing at 103, above 101. Every step passes.
Panel B: no prior downtrend. Candles 1 to 3 are identical, but the two candles before them rise from 100 to 106. The check is the move before the pattern: with no decline to reverse, it does not qualify.
Panel C: close below midpoint. Everything else matches, but the third candle's wick reaches 104 while it closes at 100. The check is the close: a wick above 101 is not enough.
A shape that fails the checklist is not a forecast of further falls. It simply is not a morning star under this definition.
Why a Completed Pattern Can Still Fail
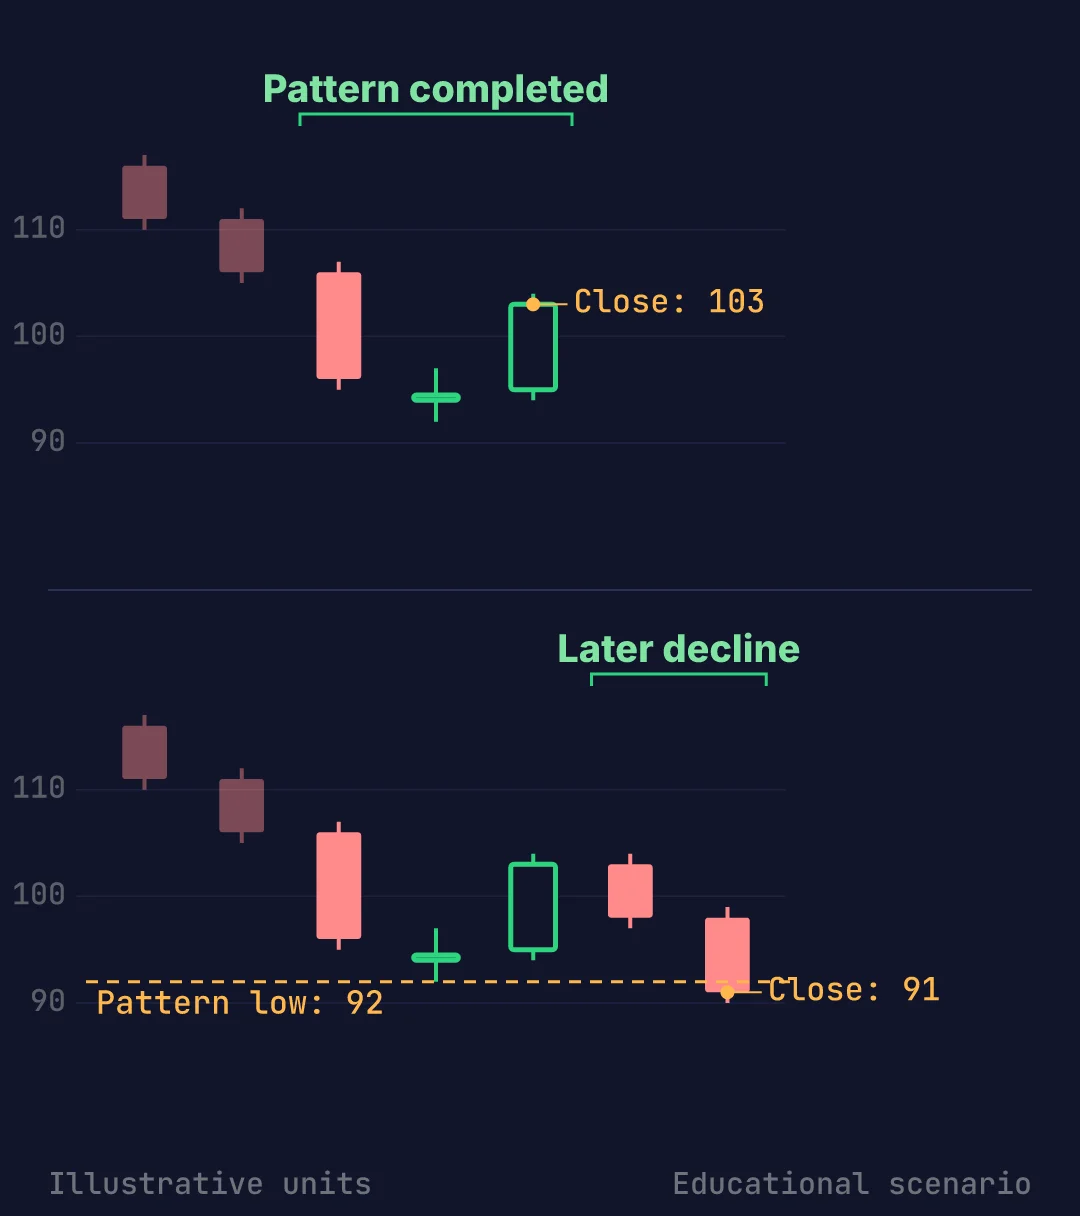
Correctly identifying a pattern and what price does next are separate things. In the diagram, the top panel stops as the third candle closes at 103: at that moment the pattern is complete. The bottom panel adds two later bearish candles, the last closing at 91, below the pattern's low of 92.
That decline does not mean the morning star never existed: it met every check, and the market did not follow through. This is one invented scenario and says nothing about how often such failures happen.
Before treating a pattern as meaningful, ask a few context questions:
- Where are the nearest price zones where buying or selling has shown up before?
- Does the pattern look the same on the timeframe you actually plan to use?
- Is a major news release due that could move the asset sharply?
- What would show the idea is wrong, and what would you do then?
These are questions for analysis, not filters that remove risk: no indicator or level makes an outcome certain. Recognising a pattern also does not replace a risk plan: decide in advance how much you are willing to lose against what you hope to gain, which the risk/reward ratio helps you weigh.
A Quick Morning Star Checklist
Run through these checks on a closed chart:
- A clear prior decline is visible to the left of the pattern.
- The first candle has a long bearish body.
- The second candle has a small body, of either colour or a doji.
- You know whether your definition requires a body gap, and the chart matches it.
- The third candle is bullish and has closed above the first body's midpoint.
- Context and risk are assessed separately, before any decision.
Once you have checked the pattern yourself, the next questions are about context: which way the broader trend points and whether news could override a small reversal. In AiTradely you can ask the AI assistant about the trend, indicators and recent news on the asset you are watching, and check the economic calendar for events due in the coming sessions. The decision on whether the pattern matters stays with you.
Nothing here is financial advice. A correctly identified morning star can be followed by further losses, so never rely on the pattern alone.
 AiTradelyYour AI trading analyst, in your pocketAI analysis for gold, forex and stocks. Build and backtest strategies, get signals, and trade from your own broker account.
 On your phoneScan for the app