Lesson 8 · 9 min

Win rate, honestly

Why a high win rate is not a promise, how many wins you really need, and why losing streaks are normal.

  1. 1
  2. 2
  3. 3
  4. 4
  5. 5
  6. 6
  7. 7
  8. 8
  9. 9
  10. 10
  11. 11
  12. 12
Step 1

Win rate is only half the story

The win rate is how often trades end in profit: 6 wins out of 10 trades is a win rate of 60%. It feels like the score that matters, but it says nothing about how big the wins and the losses were. A strategy can win almost every trade and still lose money, and another can lose most trades and still come out ahead.

The other half is the R:R from lesson 6: how far the target is compared with the stop. Win rate and R:R only mean something together.
Step 2

Same win rate, opposite results

Take the same ten trades twice. In the first row each win pays as much as each loss costs, and the result is up. In the second row the wins are only half the size of the losses, a target closer than the stop, and the very same 60% win rate loses money.

Wins of $10, losses of $10: +$60 -$40 = +$20

Wins of $5, losses of $10: +$30 -$40 = -$10

The same 6 wins and 4 losses. Only the size of the wins changed.
Step 3

How many wins you need to break even

Every R:R has a break-even win rate. At 1:1 you need to win half your trades just to stay level. At 1:3 one win pays for three losses, so 25 wins out of 100 break even, and anything above that is ahead. If you risk more than you can make, you have to be right most of the time.
R:RWINS NEEDED PER 100
2:1 (risk 2 to make 1)67
1:150
1:234
1:325
Break even = neither up nor down after many trades. Costs like the spread push each number a little higher.
Step 4

The one number that matters: result per trade

Add up all the wins, subtract all the losses, and divide by the number of trades. That is the expectancy: what one trade made on average. In this example only 4 trades out of 10 win, yet each trade made $6 on average, because every win was three times the size of every loss. A positive result per trade over many trades is what a working strategy looks like.
+$1,20040 wins of $30
$60060 losses of $10
+$6per trade, on average
100 trades: 40 wins of $30 and 60 losses of $10.
Step 5

Losing streaks are normal

Even a strategy that wins 6 trades in 10 will lose five in a row now and then. Over 100 trades the chance of at least one such streak is almost a coin flip. Streaks are part of the maths, not proof that something broke. This is exactly why lesson 7 keeps every loss small: ten losses in a row must hurt, not end you.
30 trades, 18 wins: a 60% win rate. And five losses in a row on the middle row.
Step 6

Read a strategy card

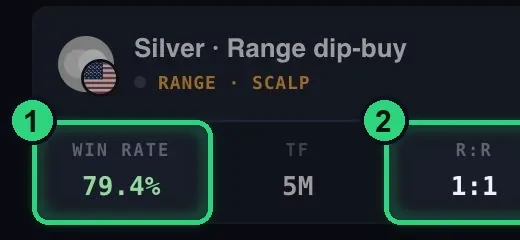
Now you can read any strategy card the honest way. The green numbers match the text:
  1. Win rate 79.4%: in its past test, this strategy won about 79 trades out of 100.
  2. R:R 1:1: wins and losses were the same size, so it needed 50 wins per 100 to break even. 79 is well above that.

Ask one more question: from how many trades? 10 trades can show 80% by luck. Trust a number more when it comes from a hundred trades or more, and expect live results to come in lower (lesson 9).

A strategy card in AiTradely: Silver range dip-buy, win rate 79.4%, R:R 1:1
A strategy card in the app on 20 October 2026 (cropped).

Watch out. Every number in this lesson describes the past. A win rate from a backtest or from your last 50 trades is a measurement, not a promise about the next 50.

Words

New words in this lesson

Win rate
How many trades out of 100 ended in profit.
Break-even win rate
The win rate at which you end up neither up nor down, for a given R:R.
Expectancy
The average result of one trade over many trades.
Losing streak
Several losing trades in a row. Normal, even for good strategies.
Sample size
How many trades a number comes from. Small samples can lie.
Check yourself

Test yourself

6 questions, 3 of them with a picture. Tap an answer to see right away if it is correct and why. You pass with 5 of 6; retry any time.

1Three sets of 10 trades. Which set made the most money?
A

Wins +$5, losses -$10

B

Wins +$30, losses -$10

C

Wins +$2, losses -$10

2At R:R 1:1, how many wins out of 100 do you need just to break even, before costs?
3At R:R 1:3, how many wins out of 100 break even?
4This strategy wins about 6 trades in 10 over the long run. It just lost 5 in a row. What is most likely?
5This card shows a win rate of 79.4% at R:R 1:1. What does it mean?
Strategy card: win rate 79.4%, R:R 1:1
6Average win $30, average loss $10, 40 wins out of 100 trades. What is the result per trade, before costs?
Strategy librarySee the real win rate of every strategyEvery strategy in the library is tested on past prices: win rate, risk to reward and the backtest chart.
Start in your browser
QR code for the AiTradely appPrefer your phone?Scan to get the app

Risk warning. Trading financial markets involves a high risk of loss and is not suitable for everyone. This course is education, not financial, investment or tax advice. The charts are drawn examples, not real prices or predictions. Past behaviour of a market does not guarantee what it does next. You make your own trading decisions.