Lesson 4 · 10 min

Support and resistance

The floor and the ceiling of a market: where moves pause, turn or break, and how to tell which.

  1. 1
  2. 2
  3. 3
  4. 4
  5. 5
  6. 6
  7. 7
  8. 8
  9. 9
  10. 10
  11. 11
  12. 12
Step 1

Support is the floor

When price falls to a level and turns back up, buyers stepped in there: to them the price looked cheap. When it happens more than once, traders start to watch that price. That level is support.
  1. Price falls to 4,100 and turns up. Nobody knows yet that it matters.
  2. It falls to 4,100 again and turns up again. Now traders notice.
  3. The third time, many are waiting there to buy. The floor holds once more.
4,1004,1204,1404,1604,180SUPPORT 4,100123
Step 2

Resistance is the ceiling

The same thing upside down. When price rises to a level and turns back down, sellers stepped in: to them the price looked expensive. That level is resistance. Between a floor and a ceiling, the market moves in a range.
  1. Price rises to 4,200 and turns down.
  2. Again at 4,200: sellers are waiting there.
  3. A third turn down. Until it breaks, 4,200 is the ceiling.
4,1204,1404,1604,1804,200RESISTANCE 4,200123
Step 3

A zone, not a line

Look closely: the three lows are not at exactly the same price. Each one went a little lower or stayed a little higher. Real levels are areas, so draw them as a band that covers the wicks, not as one exact number.
  1. This wick goes a little below 4,100.
  2. This one turns before reaching it.
  3. This one lands almost on it. All three belong to the same support zone.

Why it matters: a stop loss placed exactly on the level is often hit by a wick like the first one, just before price turns up. Many traders put the stop a little beyond the whole zone.

4,1004,1204,1404,160SUPPORT ZONE123
Step 4

A broken ceiling becomes a floor

When a candle closes above resistance, the ceiling is broken: a breakout. Often price comes back to the old ceiling later, and this time buyers defend it. Traders call that a retest. The same works the other way: broken support often becomes resistance.
  1. A strong candle closes above 4,200. The ceiling is broken.
  2. Price comes back down to 4,200 and turns up. The old ceiling is now a floor.
4,1504,2004,250CEILING, THEN FLOOR12
Step 5

Not every break is real

Price can poke above a ceiling, pull in the buyers who jump on every breakout, and then close back below it. That is a false breakout, and the buyers who jumped in are now losing. This is why many traders wait for a candle to close beyond the level, and then for the retest, before they act.
  1. The wick reaches above 4,200, but the candle closes below it. Then price falls away.
4,1204,1404,1604,1804,2004,220RESISTANCE 4,2001
Step 6

Which levels are strong

Not all levels are equal. A level usually matters more when:
  1. It was touched many times. More touches, more traders watching it.
  2. It shows on a big timeframe. A level on the daily chart beats one on the 5 minute chart.
  3. It is a round number, like 4,000 on gold or 1.1000 on EUR/USD. People like to place orders there.
  4. Price left it fast. A sharp turn away shows that many orders were waiting there.

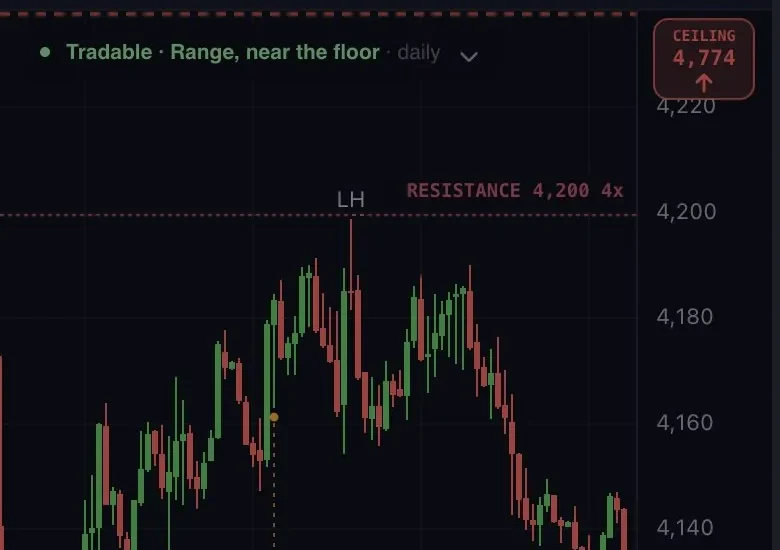
The AiTradely chart draws the nearest levels for you and counts the touches. On this screenshot, RESISTANCE 4,200 4x means gold turned down at 4,200 four times. The same chart marks support below the price. You still decide which levels matter.

Gold on the 1 hour chart in AiTradely: a dotted resistance line at 4,200 labelled 4x
Gold, 1 hour chart, in the app on 20 October 2026 (cropped).

Watch out. A level shows where price turned in the past. It can break at any moment, so a trade near a level still needs a stop loss, decided in dollars before you enter. Lesson 7 shows how.

Words

New words in this lesson

Support
A price where falls stopped before, because buyers stepped in.
Resistance
A price where rises stopped before, because sellers stepped in.
Range
A market moving sideways between support and resistance.
Zone
A level drawn as a band, because real turns never happen at one exact price.
Breakout
A candle closing beyond support or resistance.
False breakout
Price goes beyond a level, then closes back inside.
Retest
Price coming back to a level it just broke, to check if it now holds the other way.
Check yourself

Test yourself

6 questions, 3 of them on a chart. Tap an answer to see right away if it is correct and why. You pass with 5 of 6; retry any time.

1Which line on this chart is support?
4,1004,1204,1404,1604,1804,200ABC
2EUR/USD broke above the dashed line, came back to it and turned up. What did the old ceiling do?
3Look at candle 1. What happened at the ceiling?
4,1204,1404,1604,1804,2004,220RESISTANCE1
4What is the safest way to think about a support level?
5Which level usually matters more?
6Price drops below support. What is the calm way to handle it?
AI levels · GoldSee the levels the AI marks on your chartSupport and resistance on any market, with how many times the price has touched each one.
Start in your browser
QR code for the AiTradely appPrefer your phone?Scan to get the app

Risk warning. Trading financial markets involves a high risk of loss and is not suitable for everyone. This course is education, not financial, investment or tax advice. The charts are drawn examples, not real prices or predictions. Past behaviour of a market does not guarantee what it does next. You make your own trading decisions.