Lesson 3 · 9 min

Trend

Up, down or sideways: how to tell which way a market is going, and how to spot it changing.

  1. 1
  2. 2
  3. 3
  4. 4
  5. 5
  6. 6
  7. 7
  8. 8
  9. 9
  10. 10
  11. 11
  12. 12
Step 1

Uptrend: higher highs, higher lows

Prices never move in a straight line. They move in waves: up, a little down, up again. In an uptrend every wave reaches a new peak, a higher high (HH), and every dip stops above the last dip, a higher low (HL). Buyers are stronger, so they keep paying more.
4,0004,0504,1004,150HLHHHLHHHLHH
Step 2

Downtrend: lower highs, lower lows

The mirror image. In a downtrend every bounce stops below the last one, a lower high (LH), and every fall breaks a new low, a lower low (LL). Sellers are in control. Remember from lesson 1 that a falling market can be traded too, by selling first.
4,0004,0504,1004,150LHLLLHLLLHLL
Step 3

Sideways: no trend at all

When the highs stop at about the same price and so do the lows, there is no trend: the market moves sideways, in a range between a floor and a ceiling. Markets spend a lot of time like this. It needs a different plan from a trend, and lesson 4 shows how to read the two edges.
4,1004,1204,1404,160CEILINGFLOOR
Step 4

Pullbacks are part of a trend

A few red candles do not end an uptrend. A dip against the trend is called a pullback, and it is normal: some buyers take their profit, then new buyers step in. As long as the dip stops above the last low, the uptrend is intact. Many traders even wait for a pullback to join a trend at a better price.
  1. The first pullback: price dips, but stops above the last low.
  2. The second pullback, the same. Each one becomes a higher low.
4,0004,0504,1004,15012
Step 5

How a trend turns

Trends rarely end with one candle. They end in two steps. First the market fails to make a new high. Then it falls through the last higher low. Only after the second step has the uptrend really turned. Until then, it may just be a pullback.
  1. The first warning: a lower high. Buyers could not reach a new peak.
  2. The confirmation: price breaks below the last higher low. Now the lows are falling too.
4,0004,0504,100LAST HIGHER LOWHLHHHL12
Step 6

The app reads it with you

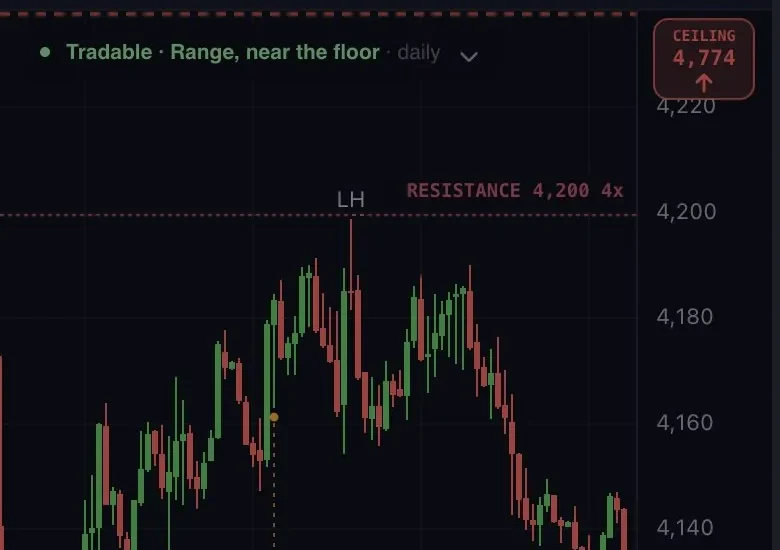
The AiTradely chart marks the turning points with the same labels, HH, HL, LH and LL, and the status line above the chart says whether the market is trending or ranging.

On this screenshot the app labels the last peak LH, a lower high, and the line at the top reads Range, near the floor: no trend on the daily chart right now. You learn the reasons here; the app saves you the counting.

Gold in AiTradely: the last peak labelled LH and a status line reading Range, near the floor
Gold, 1 hour chart, in the app on 20 October 2026 (cropped).

Watch out. A trend tells you which way the market has been going, not where it must go. Every trend ends one day, so a trade with the trend still needs a stop loss.

Words

New words in this lesson

Trend
The direction a market has been moving, read from its highs and lows.
Uptrend
Higher highs and higher lows.
Downtrend
Lower highs and lower lows.
Range
No trend: price moves sideways between a floor and a ceiling.
HH, HL, LH, LL
Higher high, higher low, lower high, lower low: the labels on turning points.
Pullback
A short move against the trend that does not break it.
Check yourself

Test yourself

6 questions, 3 of them on a chart. Tap an answer to see right away if it is correct and why. You pass with 5 of 6; retry any time.

1Which chart is in an uptrend?
A
B
C
2In this uptrend, price pulled back to point 1 and is still above the last low. What is point 1 so far?
4,0504,100HLHH1
3What does this chart show at the end?
4,0004,0504,100
4A downtrend is made of:
5In an uptrend, price drops for a few candles but stays above the last low. What is it?
6Why do many traders prefer to trade with the trend?
AI readAsk the AI which way the trend isUp, down or sideways on any market, with the highs and lows behind it.
Start in your browser
QR code for the AiTradely appPrefer your phone?Scan to get the app

Risk warning. Trading financial markets involves a high risk of loss and is not suitable for everyone. This course is education, not financial, investment or tax advice. The charts are drawn examples, not real prices or predictions. Past behaviour of a market does not guarantee what it does next. You make your own trading decisions.